SPX6900 Price Prediction 2027: Is a Triangle Breakout Setting Up?


SPX6900 just refuses to stay off crypto Twitter's radar, and the SPX6900 price prediction 2027 question is heating up again as the chart starts squeezing into something that actually looks worth watching.
$SPX is trading around $0.3697 right now, down about 1.39% on the day, but the pressure building underneath might be more interesting than the red candle suggests.
Community Sentiment Around SPX Stays Loud
SPX6900 has always carried this half-serious, half-cult energy in the community, and that hasn't changed even with the price sitting well off its highs.
A lot of the chatter around the token still leans on the idea that it's more of a meme-driven momentum play than a fundamentals story and that people who caught it early are treating it as a long-term conviction hold rather than a quick flip.
Worth keeping in mind while looking at the actual numbers, because sentiment and price action don't always move together.
Liquidation Data Shows Longs Are Still Getting Hurt
The liquidation numbers here paint a rougher picture than you'd expect from a token people are still bullish on.
Over the last 24 hours, $10.34K got liquidated in total, and $10.32K of that came from longs; shorts only lost $19.87.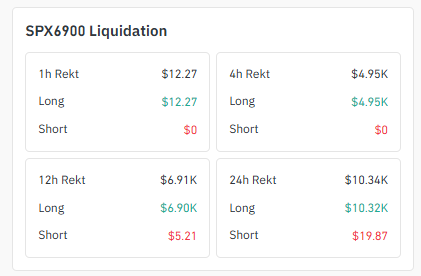
Source: Liquidation Data Taken From Coinglass
That's about as one-sided as it gets. Pull back to 12 hours and it's the same story: $6.90K in long liquidations against just $5.21 on the short side.
Over 4 hours, longs took the entire $4.95K hit with zero short liquidations, and even in the most recent hour, it was $12.27 in long losses with nothing on the short side.
Every single timeframe here shows longs absorbing almost all the pain, which tells you people have been trying to catch bottoms and getting shaken out repeatedly.
It's not necessarily bearish long-term, but it does mean the market hasn't found real footing yet; there's still a lot of trapped long positioning that needs to clear before a clean move higher can stick.
Where the Volume Is Actually Sitting
The heatmap shows SPX6900's futures volume spread across a handful of exchanges rather than piling into one dominant venue.
BingX leads with $6.60M, followed closely by Binance at $5.64M, then Bybit at $3.49M. KuCoin holds $2.69M. 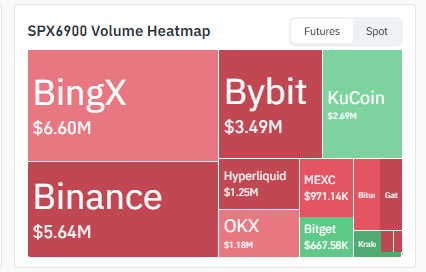
Source: Heatmap Data Taken From Coinglass
Hyperliquid sits at $1.25M, OKX at $1.18M, MEXC just under a million at $971.14K, and Bitget at $667.58K, with Bitunix, Gate, and Kraken making up smaller slivers.
Compared to tokens where one exchange dominates, this kind of spread usually means price moves a bit more gradually since liquidity isn't concentrated in a single order book, but it also means a coordinated move across multiple venues carries more weight when it happens.
Daily Chart: A Symmetrical Triangle Is Squeezing Tight
This is the part that actually matters for anyone trying to time an entry.
Zoom into the daily chart, and SPX has been carving out a textbook symmetrical triangle since the price collapse earlier in the year: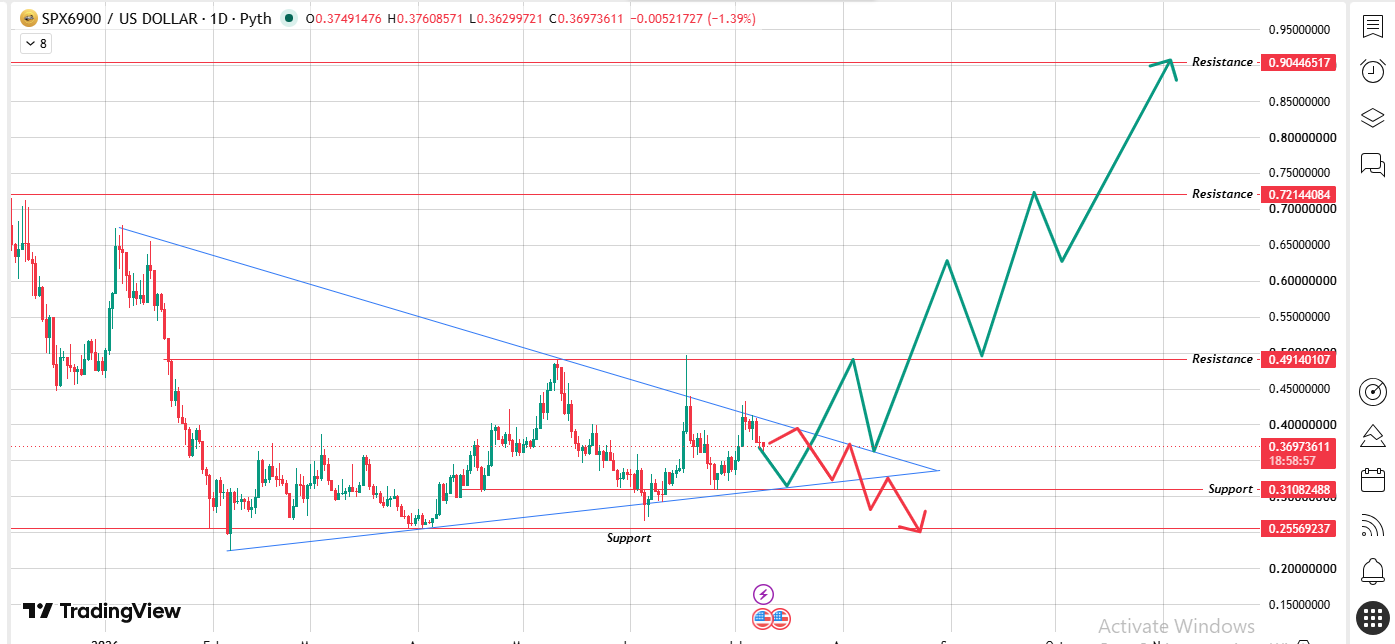
Source: Chart Taken From TradingView
lower highs coming down from above $0.75 and higher lows grinding up from around $0.20.
Both trendlines are converging right around the current price, which means this consolidation is running out of room and a decisive move is close.
Symmetrical triangles don't have a built-in directional bias on their own, but given that price entered this pattern from a strong uptrend, the higher-low structure inside it has stayed intact.
The setup leans toward an upside resolution rather than a breakdown, assuming the $0.31 support zone underneath continues to hold.
Daily Chart – Key Support & Resistance Levels
| Level Type | Price | Notes |
|---|---|---|
| Resistance 3 | $0.90446517 | Long-term target if the triangle breakout fully plays out. |
| Resistance 2 | $0.72144084 | Mid-term hurdle, roughly where the last major high formed. |
| Resistance 1 | $0.49140107 | First major resistance after a confirmed breakout. |
| Current Price | $0.36973611 | Trading near the apex of the triangle. |
| Support 1 | $0.31082488 | Triangle's lower boundary; must hold to keep the bullish setup valid. |
| Support 2 | $0.25569237 | Deeper support if the triangle breaks to the downside. |
A close above the upper triangle trendline with real volume behind it is what would actually confirm this; until then it's a setup, not a signal.
Weekly Chart: Still Inside an Ascending Channel
Pull back to the weekly timeframe, and the bigger structure becomes clearer.
SPX is down 6.67% for the week, but it's still technically trading inside an ascending channel that's been intact since the lows were put in late last year. 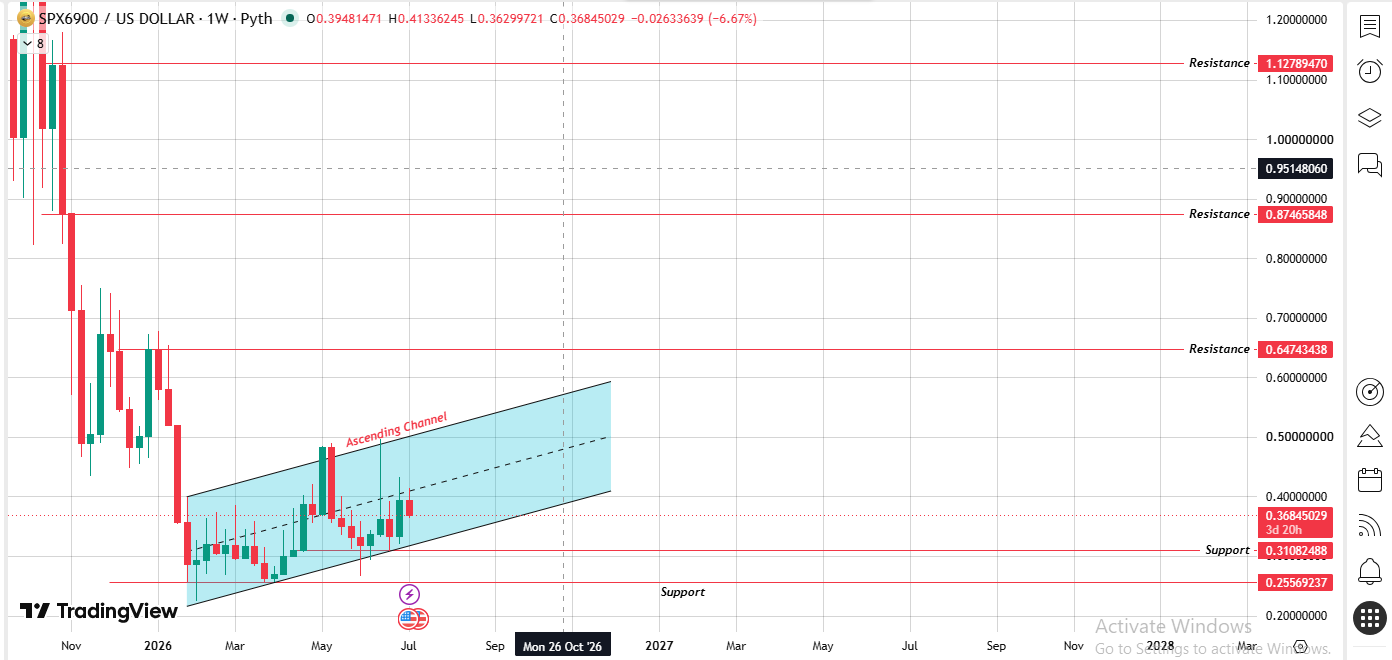
Source: Chart Taken From TradingView
Price has climbed from under $0.10 up through this channel, and even with the recent pullback, it hasn't broken the channel's lower boundary; it's just drifted back toward the middle of it.
That's a pretty normal thing to see inside an uptrend that's been running for months; not every pullback means the structure is breaking.
Weekly Chart – Key Support & Resistance Levels
| Level Type | Price | Notes |
|---|---|---|
| Resistance 3 | $1.12789470 | Far upside target, well above current channel projection. |
| Resistance 2 | $0.87465848 | Mid-term resistance, aligns with upper channel extension. |
| Resistance 1 | $0.64743438 | First major weekly hurdle above current price. |
| Current Price | $0.36845029 | Trading mid-channel after the recent pullback. |
| Support 1 | $0.31082488 | Lower channel boundary, key level to watch. |
| Support 2 | $0.25569237 | Channel invalidation zone if broken. |
As long as the price stays above that $0.31 zone and inside the channel, the broader uptrend structure remains technically intact even through weeks like this one where the candle closes red.
A Rough 2027 Target Range
If you want an actual number, here's a speculative range based on extending the current chart structure out not a forecast, just rough zones.
Bear case: If the triangle breaks down and the weekly channel fails, SPX could be stuck somewhere in the $0.05–$0.15 range by 2027.
Base case: if the triangle resolves upward and the ascending channel holds through more cycles, something in the $0.60–$0.90 range isn't unreasonable.
Bull case: If the meme momentum behind SPX carries into another full market cycle and volume keeps expanding across exchanges, a move toward $1.10+ becomes possible.
None of these are trade targets; they're just extrapolations based on current structure, and a lot can shift between now and then.
Bottom Line
None of this locks in where SPX6900 actually sits in 2027; daily and weekly charts just aren't built for that kind of range.
What the current data shows is a market squeezing into a tight daily triangle while still holding a broader weekly uptrend structure, even with longs taking most of the liquidation pain recently.
Whether this token is worth a long-term position really comes down to things outside the chart: sustained community interest, whether volume keeps growing across exchanges, and how the wider crypto cycle plays out between now and then.