SPX6900 Price Prediction 2026 to 2031: $SPX The Next 10X Meme Coin?


SPX6900 started as a joke aimed straight at the S&P 500, and somehow that joke turned into a token with an actual community, real volume, and a chart people are genuinely fighting over in the comments section.
That's the part that should make you sit up. Memes get people through the door. Price action decides who's still standing years later.
So here's what this SPX6900 price prediction 2026 to 2031 is actually built to answer:
Does the chart back up the multi-year run the community won't shut up about, or is this whole structure closer to cracking than anyone wants to admit?
Everything below comes straight off the monthly chart: the ascending channel $SPX has been riding, the resistance shelves waiting above it, and the exact path a real continuation would need to take.
Quick Snapshot: Where SPX6900 Sits Today
Current price: $0.37244852
This month's range: opened at $0.33826590, spiked to $0.43229562, got knocked back down to $0.32946337, then settled near current levels
Nearest support: $0.32928889, backed by a harder floor at $0.25569237
Nearest resistance: $0.47677089, with the bigger shelves stacked at $0.67366786 and $0.97169576
That's close to a 3x spread between the nearest support and the top marked level on this chart. Nobody's flipping this in a week. This is a long-game setup, and it only makes sense if you read it that way.
The Ascending Channel: What It's Actually Showing
This is the heartbeat of the whole chart. $SPX has been climbing inside a clean ascending channel for a while now, with a rising median line cutting straight through the middle and the current price sitting right around that midpoint instead of clinging to either wall. 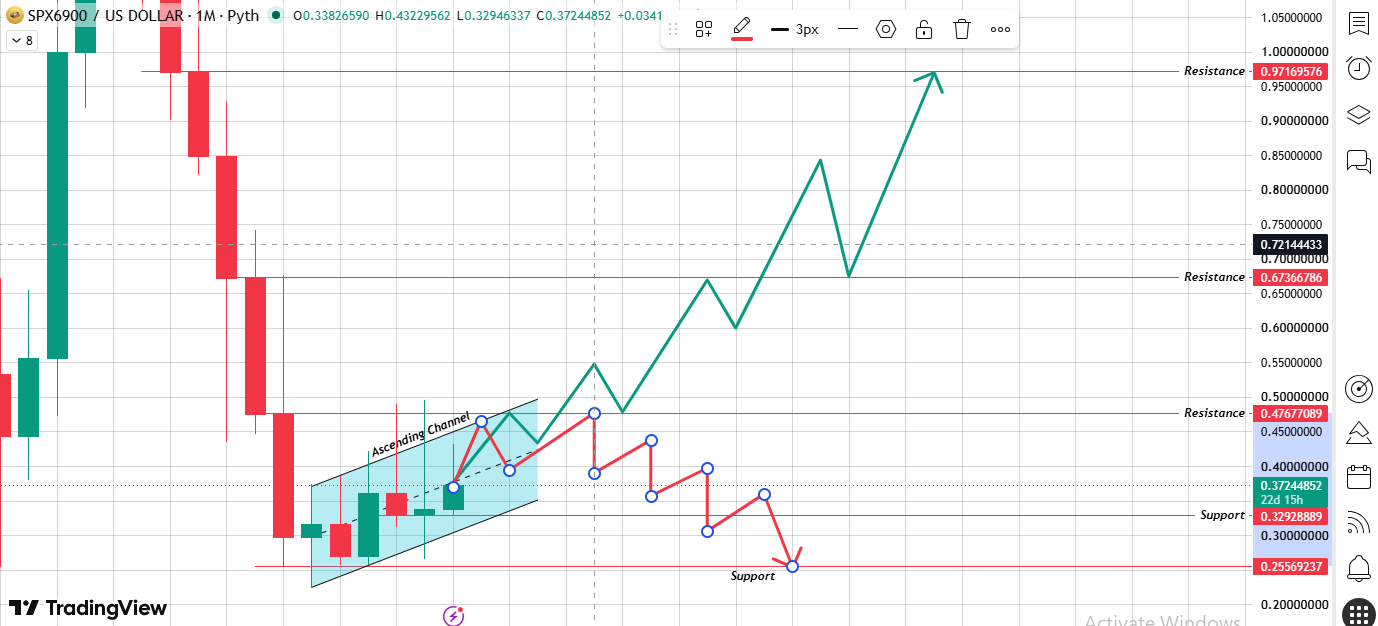
Source: Chart Taken From TradingView
Staying inside this channel is the bull case in its purest form: higher lows, structure intact, and momentum still technically alive.
Lose the bottom edge of it, though, and this stops looking like a healthy pause and starts looking like a real breakdown.
There's also a projected path drawn right on the chart, sketching out what a strong continuation could look like: a push at $0.47677089, a pullback, a run through $0.67366786, another pullback, then a real shot at the $0.97169576 zone.
None of that's locked in. It's a scenario, not a promise, and it only holds up as long as the channel underneath it does too.
Why the Chart Shows Two Very Different Futures
$SPX keeps the channel alive, grinding through each resistance shelf with that same push-pull-retest rhythm you can see mapped out.
The channel snaps. Price drops under $0.32928889, eventually tests the tougher $0.25569237 floor, and the whole multi-year bull case gets put on ice until a fresh base gets rebuilt from the ground up.
The fork comes down to one simple question: Can $SPX keep printing higher lows inside this structure or not?
A confirmed monthly close below the channel's floor is the moment this flips from "healthy pullback" to "actual breakdown," full stop.
SPX6900 Price Prediction 2026: Where Does SPX Go From Here?
For the rest of this year, the channel is pretty much the entire story.
Price sitting mid-channel around $0.37244852 leaves room to swing hard in either direction without breaking anything major just yet.
Clear $0.47677089, and that's your first real confirmation this projected path has actual teeth. Lose $0.32928889 instead, and $0.25569237 comes right back into the picture, pushing a real recovery well past this year.
SPX6900 Price Prediction 2027 to 2028
If the channel holds, this is where things get genuinely interesting: a run at $0.47677089, a pullback, then a real test of $0.67366786.
Actually getting there means SPX has to keep dragging in fresh capital well beyond its original meme-launch crowd because a move that size needs sustained volume behind it, not a single viral pump.
This is also the stretch where SPX's whole identity gets tested.
The "flip the S&P 500" energy that guys like Murad Mahmudov have been pushing under the broader memecoin supercycle thesis.
Either keeps pulling in new believers or starts fading the way most meme narratives eventually do once the novelty wears off.
SPX6900 Price Prediction 2029 to 2031
If the channel's still standing this far out, $0.97169576 becomes the real long-range target, following that same push-pull rhythm mapped out from the lower levels.
Getting there would mean SPX compounded gains inside this channel for years without a structural break, something almost no meme-driven token actually pulls off across multiple full market cycles.
It's just as likely SPX ends up stuck well below that level if momentum dries up or the broader meme coin sector cools off hard.
Channels don't hold forever just because they've held so far; that's the part people conveniently forget when they're deep in a bag.
SPX6900 Target Table (2026–2031)
| Year | Low Estimate | Mid-Estimate | High Estimate |
|---|---|---|---|
| 2026 | $0.2557 | $0.3724 | $0.4768 |
| 2027 | $0.3000 | $0.4768 | $0.6737 |
| 2028 | $0.3500 | $0.6000 | $0.7217 |
| 2029 | $0.4000 | $0.7217 | $0.8500 |
| 2031 | $0.4500 | $0.8500 | $0.9717 |
The low column assumes the ascending channel eventually breaks and SPX drifts back toward its support zones. The high column rides the chart's projected path all the way to the $0.97169576 shelf.
What Actually Decides This
A handful of real factors sit underneath all these lines, and honestly, they matter a lot more than the channel ever will on its own.
Does the community narrative stay alive? SPX6900 runs almost entirely on sentiment and social momentum, not fundamentals. Kill the narrative, and the demand story underneath this whole chart goes with it.
Does the ascending channel actually hold? This is the single biggest gate on the entire setup.
Every resistance target above current price only means something if SPX keeps printing higher lows instead of caving through the channel's floor.
Broader meme coin and altcoin cycles. SPX doesn't trade in a bubble; a stronger or weaker crypto market overall is going to decide whether this channel keeps climbing or just stalls out in the middle of nowhere.
Whale activity and liquidity. Meme coins with concentrated holders can swing hard in either direction off a handful of big decisions, and that can either supercharge this setup or wreck it completely, often with almost no warning.
Bottom Line
This chart lays out a genuinely widespread array of outcomes for SPX6900 between now and 2031, and that's the real takeaway here, not a hedge dressed up to sound cautious.
The ascending channel gives a solid framework for the bull case, but a multi-year window is more than enough time for the whole thing to break down and rebuild itself more than once.
Treat $0.97169576 as the outer edge of what this chart currently supports, not a done deal. And keep your eyes on whether SPX holds that channel floor.
In the meantime, that's the level actually keeping this entire forecast breathing.
Disclaimer: This article is for informational purposes only and does not constitute financial, investment, or trading advice. Cryptocurrency markets are highly volatile and speculative. All price levels and scenarios discussed are based on chart analysis and publicly available data and are not guarantees of future performance. Always do your own research and consult a licensed financial advisor before making any investment decisions.