Stable Price Prediction: $STABLE Ecosystem Update, StablePay Launch!


Stable is the network behind StablePay and StableEarn, and this Stable Price Prediction looks at whether growing ecosystem activity can offset the technical damage over the next one to two weeks.
A bullish case builds if the price reclaims $0.032656, while a break below $0.030502 would open further downside.
Here's what the chart, unlock schedule, and ecosystem updates show.
Stable Price Prediction Today: Market Overview
Metric | Value |
Price | $0.031584 |
Market Cap | $791.25M |
FDV | $3.15B |
24h Volume | $10.78M |
Vol/Mkt Cap (24h) | 1.35% |
Liquidity/Mkt Cap | 0.12% |
Total Supply | 100B $STABLE |
Circulating Supply | 25.08B $STABLE |
Holders | 7.79K |
Source: Data from CoinMarketCap as of 4/08/2026. Figures may vary slightly across other tracking websites.
STABLE Token Unlock: What's Coming This Week
24.22B $STABLE tokens, or 24.22% of total supply, are currently unlocked and in circulation.
The remaining 75.77B $STABLE, which works out to 75.78% of the total supply, is still locked and hasn't entered the market yet. 
Source: Data From CoinGlass
There's no untracked supply, meaning the entire 100B token supply is fully accounted for between unlocked and locked categories.
The next scheduled unlock event falls on August 8, 2026, when 888.80M $STABLE will be released, equal to 0.89% of the total supply.
Compared to total market cap, this is a relatively small unlock, so it's unlikely to create major sell pressure on its own.
That said, with over three-quarters of supply still locked, the pace and size of future unlock events remain worth tracking as a factor that could weigh on price over the medium term, even if this particular unlock is modest.
Stable Ecosystem Update: July Milestones
$Stable's official account announced the latest edition of its ecosystem newsletter, The $Stable Standard, highlighting several developments from July. 
According to the post, StablePay went live during the month, network activity surpassed 1M transactions in a single day amid rising memecoin activity on the chain, and $StableEarn continued to grow.
These updates suggest expanding product usage on the network even as price has pulled back, a divergence worth watching heading into August.
$STABLE Price Prediction Chart: Technical Analysis
Pair: $STABLE/USD · Market: Spot (Crypto) · Timeframe: 4H · Source: TradingView · Timestamp: August 4, 2026, 12:16 UTC+5:30
$STABLE is trading at $0.031584 after breaking down from a long-ascending trendline that had supported the price since early June.
Price rallied as high as $0.0420 in late July before reversing sharply, breaking both the EMAs and trendline and its short-term structure to slide toward a recent low near $0.0305.
The chart also marks a bearish EMA (Exponential Moving Average, a momentum indicator that weights recent candles more heavily) crossover from that same period: the shorter EMA, now at $0.032451, crossed below the longer EMA, now at $0.034036, and both remain above the current price as overhead resistance.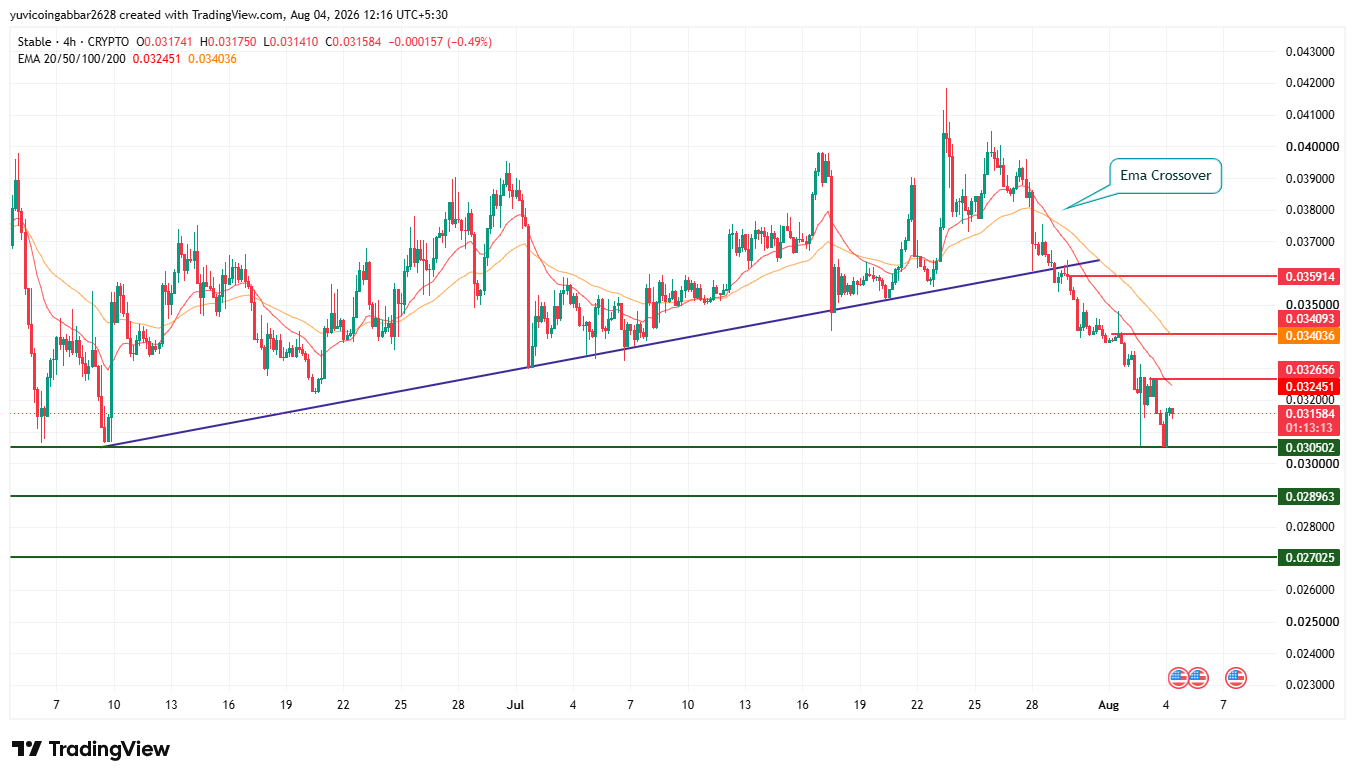
Level Type | Price |
Resistance 3 | $0.035914 |
EMA (50) | $0.034036 |
Resistance 2 | $0.034093 |
Resistance 1 (nearest) | $0.032656 |
EMA 20 (shorter, bearish crossover level) | $0.032451 |
Immediate Price Reference | $0.031584 |
First Support | $0.030502 |
Deeper Support | $0.028963 |
Structural Floor | $0.027025 |
Stable Forecast: Bull Case vs. Bear Case
STABLE price target Bull case: Reclaiming the nearest resistance at $0.032656 and holding above the EMA cluster near $0.032451 to $0.034036 would be the first sign the trendline breakdown is stabilizing.
A confirmed move above $0.034093 would put the bearish EMA crossover in question and open the path toward $0.035914.
STABLE price target Bear case: A continued failure to reclaim $0.032656, followed by a break below $0.030502, would confirm the trendline breakdown and bearish crossover are still driving price.
Losing $0.028963 would expose $0.027025 as the next structural floor.
STABLE price target 2026: Can STABLE Reach $0.035914?
$0.035914 is the highest resistance level marked on the chart. Reaching it would require STABLE to first reclaim the EMA cluster near $0.032451 to $0.034036, then clear $0.032656 and $0.034093 in sequence, a multi-stage move rather than a single leg.
What Could Invalidate the Bullish Setup?
A rejection at $0.032656 followed by a failure to hold $0.030502 would confirm the bearish EMA crossover remains in control.
A deeper break below $0.028963 would undermine the recovery attempt entirely, opening a path toward the $0.027025 structural floor.
Stable Price Prediction: Expert View
According to CoinGabbar analysts, the chart and the ecosystem updates are pulling in different directions right now.
Technically, the trendline breakdown and bearish EMA crossover both point to weakening short-term momentum, and the upcoming August 8 unlock adds a layer of potential sell pressure on top of that.
On the other hand, $StablePay going live, network transactions crossing 1M in a day, and continued StableEarn growth all point to real product traction.
The $0.030502 to $0.032656 zone is the near-term battleground: losing it would favor the bears despite the ecosystem momentum, while reclaiming it would give bulls a case that the pullback is temporary.
Stable Price Prediction: Data Sources
Price, EMA, and chart pattern data referenced from a 4H $STABLE/USD chart via TradingView, timestamped August 4, 2026, 12:16 UTC+5:30.
Market cap, FDV, volume, and supply data referenced from CoinMarketCap. Token unlock figures are referenced from CoinGlass
Ecosystem update referenced from $Stable's official account on X.
Disclaimer: This piece is for informational purposes only and isn't financial advice. The levels and scenarios above are based on technical chart analysis and publicly available data at the time of writing, and crypto markets can move sharply within hours, so past patterns don't guarantee future outcomes. It's worth doing independent research and considering your own risk tolerance before acting on any of the levels discussed here.


















