Stable Price Prediction: New All-Time High, Is $0.05 Next?


STABLE is having a strong day, up 14.8% to $0.04104, after pushing through a resistance zone that had capped the price for a while.
This stable price prediction looks at whether that momentum can carry through to a new high or whether buyers need to catch their breath first.
Short version: STABLE just broke out, retested the breakout level, and is now pressing toward territory it hasn't traded at before. What happens next depends on whether that push holds or gets rejected.
STABLE Price Today and Market Snapshot
STABLE is trading at $0.04104 right now, up a sharp 14.8% over the past 24 hours, with the day's range stretching from $0.03555 up to $0.04183.
Market cap sits at $1.021 billion on a circulating supply of 24.739 billion tokens out of a fixed 100 billion max supply. 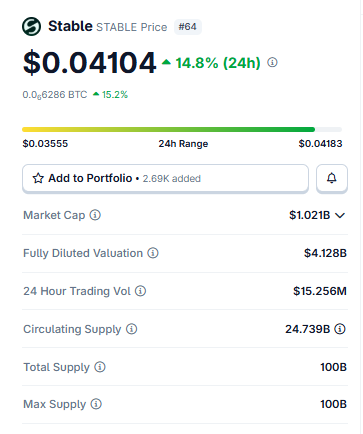
Fully diluted valuation is considerably higher at $4.128 billion, worth noting since only about a quarter of total supply is currently circulating. 24-hour trading volume is $15.256 million, decent for a token this size and consistent with the kind of activity you'd expect during a breakout day.
STABLE Liquidation Data And Exchange Volume
Liquidations over the past 24 hours totaled $45.54K, and the split tells its own story: $38.78K of that came from short positions, with only $6.77K from longs. 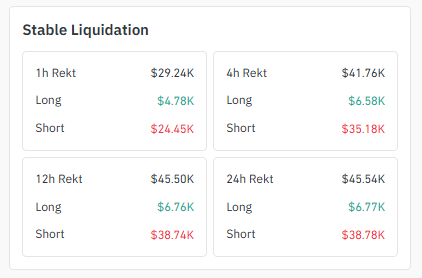
Source: Liquidation Data Taken From Coinglass.
It lines up cleanly with the price action; shorts got caught leaning the wrong way as STABLE ripped through resistance and got squeezed out as price kept climbing.
The liquidation heatmap pattern here is a textbook short squeeze, not a long-side flush.
Exchange volume is led by Binance at $11.40 million, followed by OKX at $5.83 million, BingX at $6.60 million, and Bybit at $4.70 million.
Hyperliquid ($1.59M), LBank ($1.33M), Bitunix ($767.68K), and MEXC ($822.01K) make up the rest of tracked futures activity. 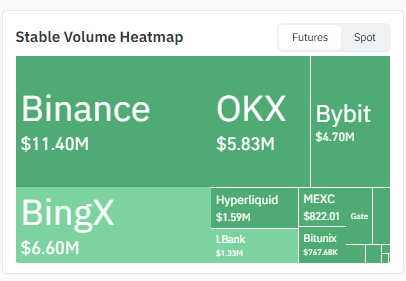
Source: Volume Heatmap Data Taken From Coinglass.
With Binance carrying the largest share, any confirmation of a breakout above the all-time high should show up there first in a meaningful way.
STABLE Holder Concentration
Holder data on STABLE shows an extremely tight distribution. The top 100 wallets control 99.80% of supply, and the top 5 addresses alone hold 90.91%, with the top 10 accounting for 96.16%.
Whale-tier wallets, just 37 addresses, or 0.54% of all holders, control 99.41% of supply between them.
The Gini score sits at 0.9993, about as close to maximum inequality as a distribution gets.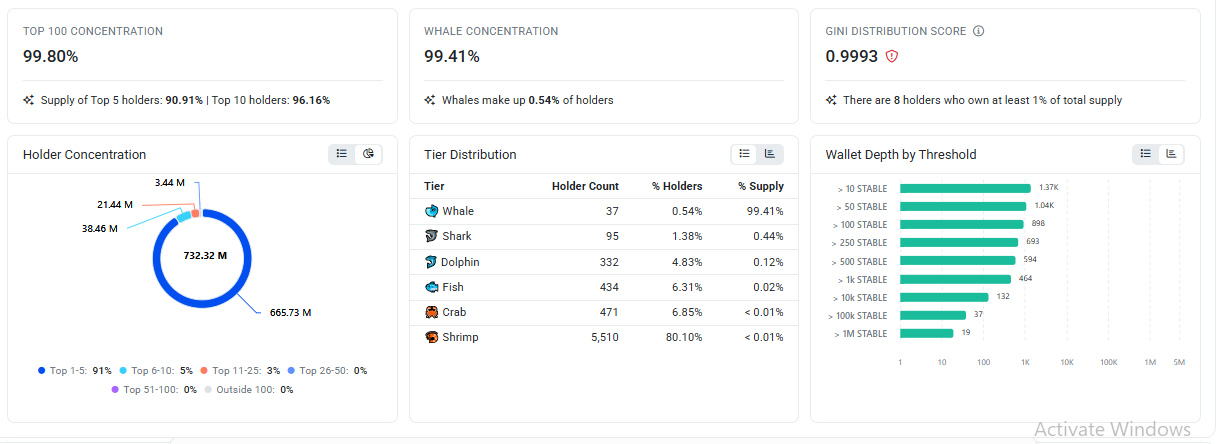
Source: Holder Data Taken From Bscscan.
Breaking down the tiers: 95 shark wallets hold 0.44%, and everyone below that, dolphin, fish, crab, and shrimp tiers combined, roughly 6,700 addresses, split the remaining fraction of a percent.
Over 5,500 shrimp-tier wallets make up 80% of all holders and control less than 0.01% of supply.
This kind of holder concentration means STABLE's price action is heavily influenced by a small handful of large wallets, and it's worth factoring that into any read on today's move.
A breakout this sharp with holdings this concentrated raises the question of how much of the volume is organic versus large-holder repositioning.
STABLE News And Social Sentiment
Community sentiment around the broader Stable ecosystem has been active, with accounts highlighting STABLE as the governance token powering the chain alongside USDT, which functions as the network's native gas and primary liquidity token. 
Source: Data taken from Captain Gm, X Account
The pitch from supporters centers on fast, cheap, USDT-native payment flows, positioning Stablechain as infrastructure for payments and DeFi rather than a speculative play on its own.
This kind of narrative tends to circulate more during price spikes like today's, so it's worth treating as sentiment rather than confirmation of anything new.
STABLE 4H Chart: Resistance Broken, Retested, Still Climbing
The 4-hour chart is where the real action shows up. Price had been respecting an ascending trendline for a while, then broke straight through a resistance zone sitting near $0.040.
The breakout came with a retest inside the same candle: price pushed through, dipped back to confirm the level held as new support, and kept climbing from there.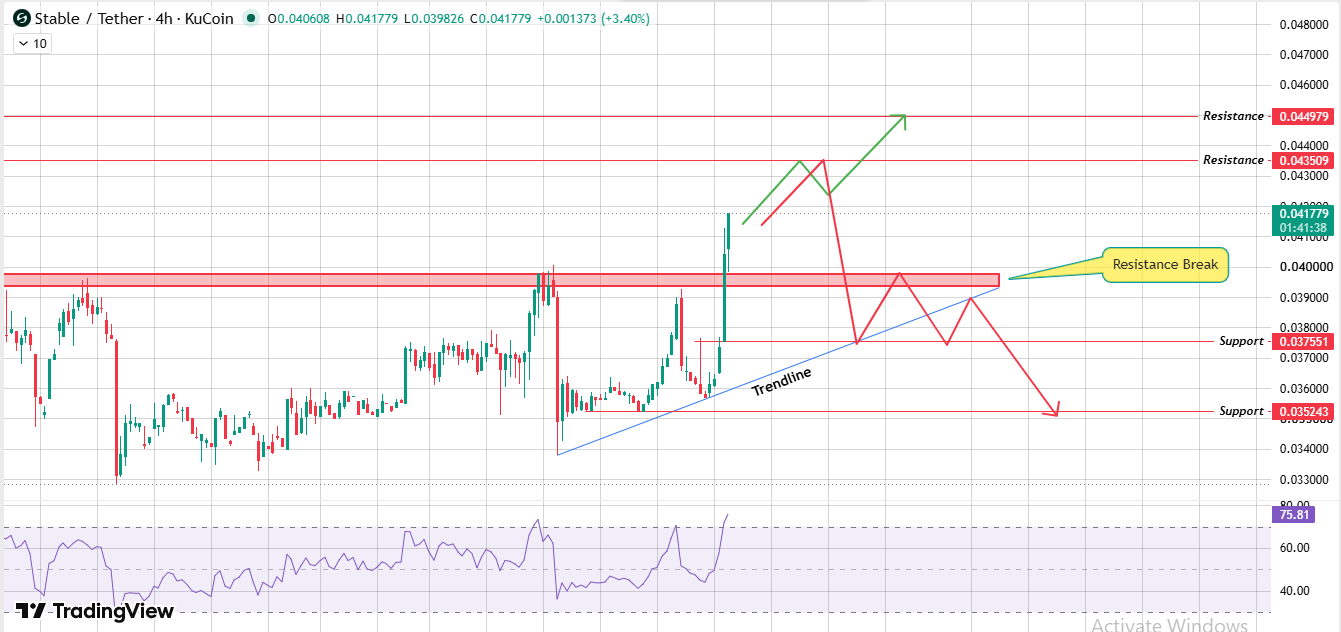
Source: Chart Taken From TradingView
With that resistance level now behind it, the next targets on the 4H chart sit at $0.043509 and $0.044979. Given the strength of this bullish breakout and the retest already playing out, both of those levels look reachable before the current 4H candle even closes.
If momentum stalls instead, the trendline support sits back near $0.037551, with $0.035243 as the deeper floor if things reverse hard.
RSI on the 4H is running hot at 75.81, solidly in overbought territory.
It doesn't mean a reversal is guaranteed; strong breakouts can stay overbought for a while, but it does mean the move is stretched, and a pause or pullback wouldn't be surprising before the next leg.
STABLE 1D Chart: All-Time High In Sight, Fibonacci Extension Waiting Above It
Zooming out to the daily chart, the story gets more interesting. STABLE has also been respecting its trendline on this timeframe, and it just broke through a resistance zone that had held for a stretch.
Price is now closing in on $0.044923, the level marked as the "1" point on the chart's Fibonacci structure, which lines up with the token's prior high. 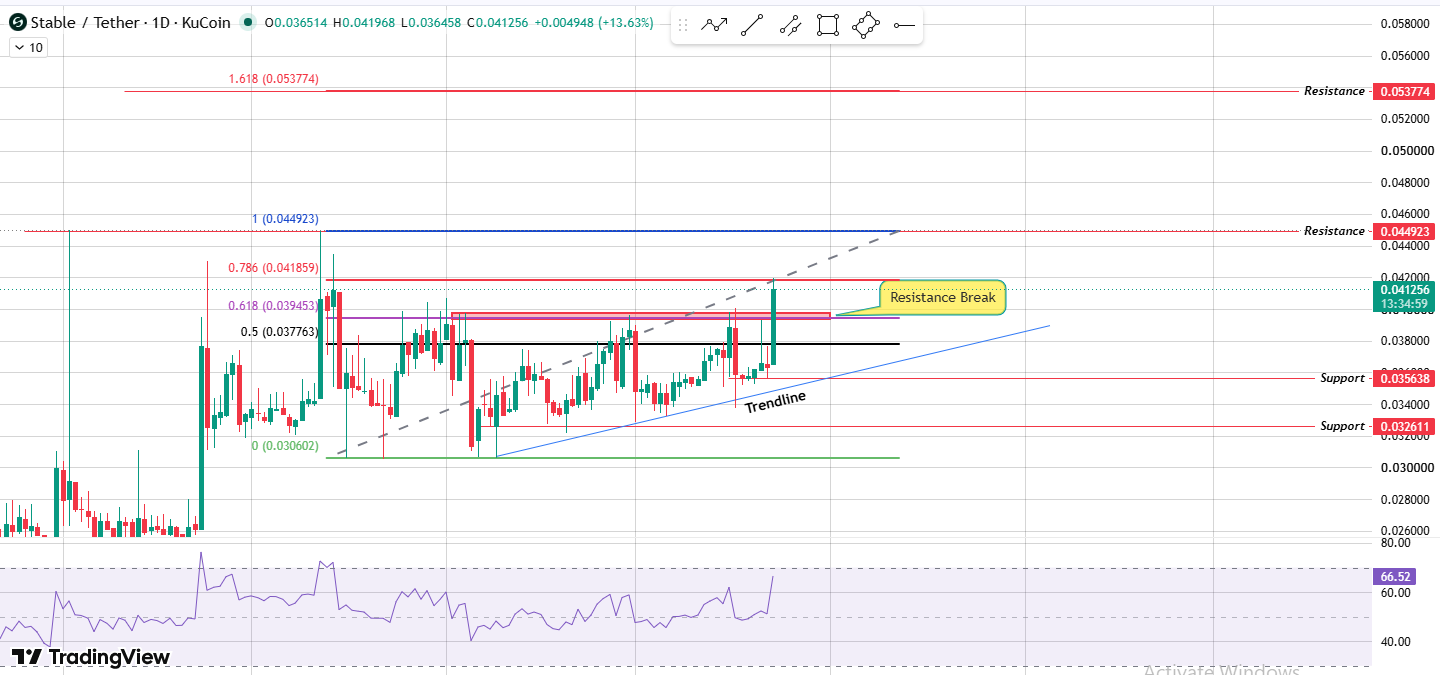
Source: Chart Taken From TradingView
In plain terms, STABLE is approaching its all-time high.
Two things can happen from here. If the price clears that level cleanly and holds above it, the next stop is the 1.618 Fibonacci extension at $0.053774, a fresh price target in the territory the token has never traded in before.
But if price gets to that high and can't sustain it, a rejection is a real possibility, and the chart's own Fibonacci levels mark where a pullback would likely land: $0.041859 first, then $0.039453, and $0.037763 below that.
A deeper bearish breakdown past those levels would put the 1D support zones at $0.035638 and $0.032611 back in play.
RSI on the daily is at 66.52, elevated but not yet flashing the same overbought warning as the 4H.
STABLE Price Prediction: Bull, Base, and Bear Scenarios
| Scenario | Trigger | Near-Term Target | Extended Target |
|---|---|---|---|
| Bull | ATH near $0.044923 clears with strong volume while the 1D trendline holds. | $0.044979 | $0.053774 (Fibonacci 1.618 extension) |
| Base | Price stalls below the ATH, trading between $0.0375 and $0.0450. | Range-bound consolidation | RSI cools from overbought before the next directional move. |
| Bear | Rejection at the ATH as both the 4H and 1D trendlines break lower. | $0.041859 $0.039453 | $0.037763 $0.035638 $0.032611 |
The bullcase here isn't hypothetical; it's already in motion.
The question is whether STABLE has the volume behind it to clear a level it's never closed above, or whether this is a first attempt that needs a retest before it actually breaks through for good.
How STABLE Compares To Similar Infrastructure Tokens
| Token | 24H Change | Setup |
|---|---|---|
| STABLE | +14.8% | Resistance broken, retested, approaching all-time high |
| Comparable Governance Tokens | Mixed | Range-bound near prior highs |
| Comparable L1/Infrastructure Tokens | Mixed | Consolidating below resistance |
Comparison is illustrative and based on general sector positioning; always check live charts for the most current levels across tokens.
Final Outlook: Is It Stable, and Is It Going to Go Up?
Both timeframes are telling the same story right now. STABLE broke a resistance zone on the 4H, retested it, and kept climbing.
On the daily, it did something similar and is now within reach of its all-time high.
This kind of alignment across timeframes doesn't happen often, and it's usually a sign that the move has real conviction behind it rather than just noise on one chart.
Still, overbought RSI on the 4H and the sheer concentration in STABLE's holder base are both reasons to stay level-headed here.
BTC dominance and ETH correlation matter for a token like this too, since infrastructure and payment-narrative tokens tend to get more attention when the broader market is calm and risk appetite is up.
If Bitcoin stays steady, STABLE's push toward its all-time high has a cleaner path.
If BTC gets volatile, expect this move to either accelerate faster than the chart suggests or stall out entirely.
The levels that matter most: $0.044923–$0.044979 as the all-time high zone to watch first, with $0.053774 as the Fibonacci extension target if that clears.
On the downside, $0.041859 and $0.039453 are the first supports if momentum fades, with $0.035638 and $0.032611 further down in the deeper support zone if this turns into a real reversal.
Whether this stable price prediction plays out bullish depends entirely on whether STABLE can close above its old high, not just touch it.
Quick Glossary
An ascending trendline is a rising line connecting a series of higher lows, and it's used to judge whether buyers keep stepping in on dips.
A resistance break happens when price closes above a level that had previously capped upward moves, and a retest is when price dips back to confirm that broken level now holds as support.
A Fibonacci extension projects a target beyond the current price range using ratios drawn from a prior swing; the 1.618 level used here is one of the more common extension targets traders watch.
RSI, or Relative Strength Index, is a 0–100 momentum gauge; above 70 usually signals overbought conditions, and below 30 usually signals oversold, and it can stay elevated for a while during strong trends without an immediate reversal.
A Quick Note On How This Was Put Together
Every level in this piece, the trendlines, the resistance zones, and the Fibonacci markers, came directly off the 4H and 1D charts reviewed while writing this, nothing extrapolated beyond what those charts show.
Holder concentration and Gini score figures reflect a snapshot analytics pull taken at the time of writing.
Liquidation and exchange volume numbers are sourced from Coinglass-style data.
Price, market cap, and supply figures are a snapshot from July 23, 2026, so some of these numbers will have moved by the time you're reading this. Check a live chart before acting on anything here.
Disclaimer: This article is for informational purposes only and is not financial advice. Cryptocurrency markets are volatile; do your own research before investing.

















