STABLE Price Prediction: Trendline Breakdown and Key Levels


Stable is the network behind StablePay and StableEarn, and this STABLE price prediction looks at how much room the token has to recover after a rough technical stretch.
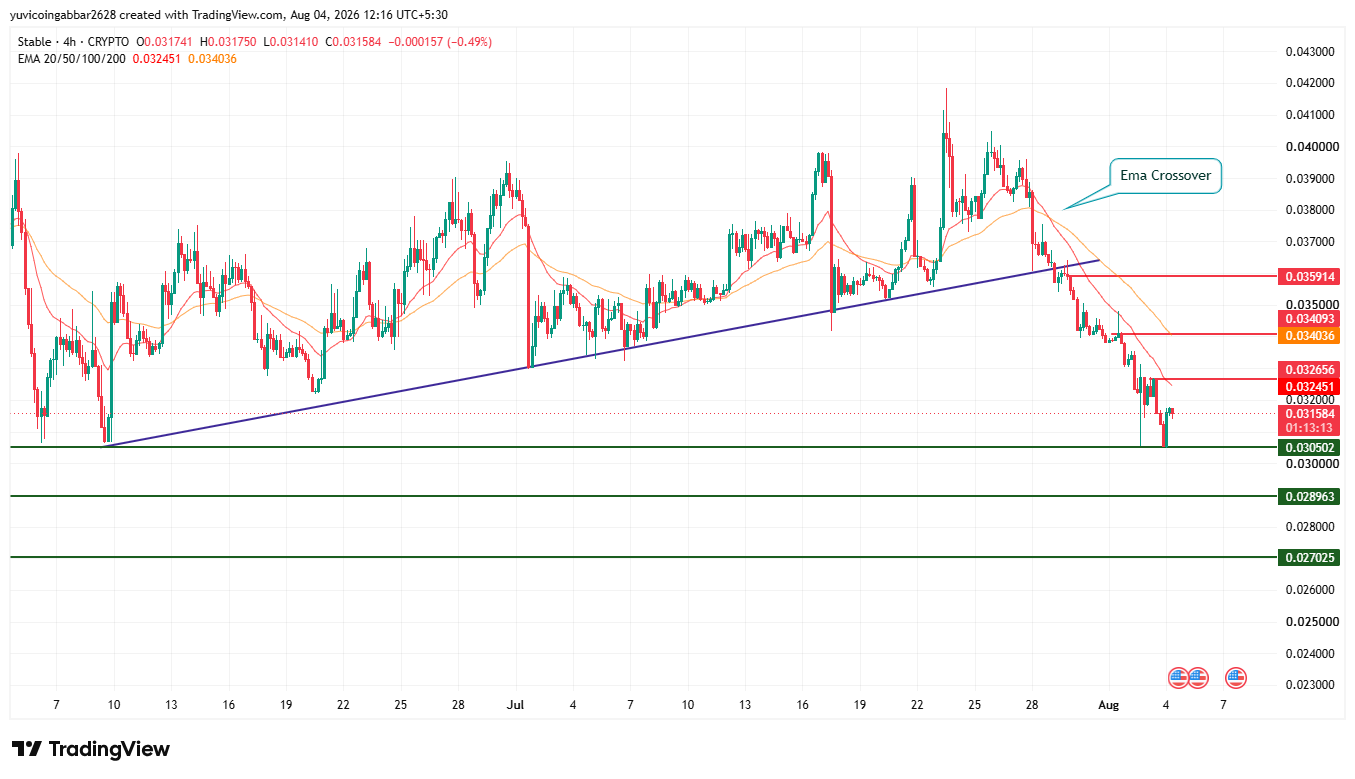
Over the next one to two weeks, a bullish case starts to take shape if the price climbs back above $0.032656, while a break under $0.030502 would open the door to further downside.
Here is what the chart and the unlock calendar are showing.
STABLE Price Snapshot
Metric | Value |
Price | $0.031584 |
Market Cap | $791.25M |
FDV | $3.15B |
24h Volume | $10.78M |
Vol/Mkt Cap (24h) | 1.35% |
Liquidity/Mkt Cap | 0.12% |
Total Supply | 100B STABLE |
Circulating Supply | 25.08B STABLE |
Holders | 7.79K |
Source: Data from CoinMarketCap, as of August 4, 2026. Figures may vary slightly across other tracking sites.
$STABLE Token Unlock: What's Coming This Week
Of the total 100B supply, 24.22B STABLE, or 24.22%, is already unlocked and circulating.
The remaining 75.77B STABLE, close to 75.78 percent of supply, is still locked and has not yet reached the open market.

Source: Data From CoinGlass
Every token is accounted for across these two categories; there is no untracked supply floating around outside them.
The next unlock lands on August 8, 2026, releasing 888.80M STABLE, about 0.89 percent of total supply.
Relative to the current market cap, this is a fairly small release and unlikely to trigger heavy sell pressure by itself.
That said, with three-quarters of the supply still locked, how future unlocks are paced and sized is worth keeping an eye on as a medium-term factor, even though this particular one looks modest.
$STABLE Price Prediction Chart: Technical Analysis
Pair: STABLE/USD | Market: Spot | Timeframe: 4H | Source: TradingView | Timestamp: August 4, 2026, 12:16 UTC+5:30
STABLE is currently priced at $0.031584, having broken down from a long ascending trendline that had held since early June.
The token peaked near $0.0420 in late July before reversing sharply, taking out both EMAs and the trendline on its way down to a recent low around $0.0305.
That same move produced a bearish EMA crossover, where the shorter moving average, now at $0.032451, dropped below the longer one, now at $0.034036. Both sit above the current price, meaning they are now acting as resistance rather than support.
Level Type | Price |
Resistance 3 | $0.035914 |
EMA (50) | $0.034036 |
Resistance 2 | $0.034093 |
Resistance 1 (nearest) | $0.032656 |
EMA 20 (shorter, bearish crossover level) | $0.032451 |
Immediate Price Reference | $0.031584 |
First Support | $0.030502 |
Deeper Support | $0.028963 |
Structural Floor | $0.027025 |
Bull case: Reclaiming the nearest resistance at $0.032656 and holding above the EMA cluster between $0.032451 and $0.034036 would be the earliest sign the trendline breakdown is losing momentum.
A confirmed move past $0.034093 would call the bearish crossover into question and put $0.035914 in view.
Bear case: Another failed attempt at $0.032656, followed by a break below $0.030502, would confirm both the trendline breakdown and the bearish crossover are still steering price.
Losing $0.028963 would put the $0.027025 structural floor in play as the next stop.
What Would Invalidate the Bullish Setup
A rejection right at $0.032656, combined with a failure to defend $0.030502, would signal the bearish EMA crossover is still firmly in control.
A deeper slide below $0.028963 would undercut the recovery case entirely and open a path toward the $0.027025 structural floor.
Disclaimer
This piece is for informational purposes only and is not financial advice. The levels and scenarios above are based on technical chart analysis and publicly available data at the time of writing, and crypto markets can move sharply within hours, so past patterns do not guarantee future outcomes. It is worth doing independent research and considering your own risk tolerance before acting on any of the levels discussed here.
Also read:

















