Starpower Price Prediction 2026: Can $STAR Reclaim $0.20?


A quiet DePIN token just posted one of its sharpest daily moves in weeks, and it has almost nothing to do with hype threads or influencer calls. Away from the noise, wallets started shifting, and a chart pattern that had been coiling for over a month finally showed its hand. Is this the start of a real recovery, or just another bounce inside a longer downtrend that traps buyers before rolling over again? This Starpower price prediction walks through what the daily setup, the weekly channel, and the wallet concentration data actually say right now.
Table of Contents
Why STAR Is Moving Today
STAR Technical Analysis: Daily Chart
STAR Technical Analysis: Weekly Chart
STAR Support And Resistance Levels
STAR Price Prediction: Scenarios By Timeframe
Tokenomics And Whale Concentration
Liquidations And Exchange Volume
STAR And The DePIN Altcoin Narrative
STAR Market Outlook: Risks To Watch
Key Takeaways
STAR trades near $0.1008, up over 25% in 24 hours per CoinMarketCap, still down more than 68% from its May 2026 high.
Daily RSI sits near 41.74, recovering off the lows, not overbought yet.
Top 100 wallets hold 74.00% of tracked supply. That's the number to watch.
Invalidation for the bullish case sits under $0.0710 on the daily chart.
Why STAR Is Moving Today
This Starpower price prediction matters because STAR trades near $0.1008 after CoinMarketCap logged a move of more than 25% in 24 hours. Turns out, the daily chart had been carving out a falling wedge for weeks, and wedges like that tend to snap hard once price clears the upper trendline.
Volume backed the move too. It jumped over 46% in a day per CoinMarketCap, and futures activity picked up across Binance and LBank per CoinGlass. That combination gave traders a reason to bid STAR instead of scrolling past it.
Timing matters here. As a DePIN and AI-energy token, STAR often catches a bid whenever broader altcoin risk appetite improves, and this bounce lines up with a stretch where several small-cap names found buyers again, not unlike the setup covered in the altcoin rally breakdown on GIGGLE and SOON, though STAR's trigger traces back to its own chart structure.
Anyone tracking where $STAR actually trades should check new pairs on an exchange listing tracker, since thin order books can exaggerate a move like this one fast.
STAR Technical Analysis: Daily Chart
On the daily chart, $STAR is trading near $0.1003, holding above the lower rail of a falling wedge that's been building since mid-July. Resistance stacks at $0.1287, then $0.1793, then $0.2605.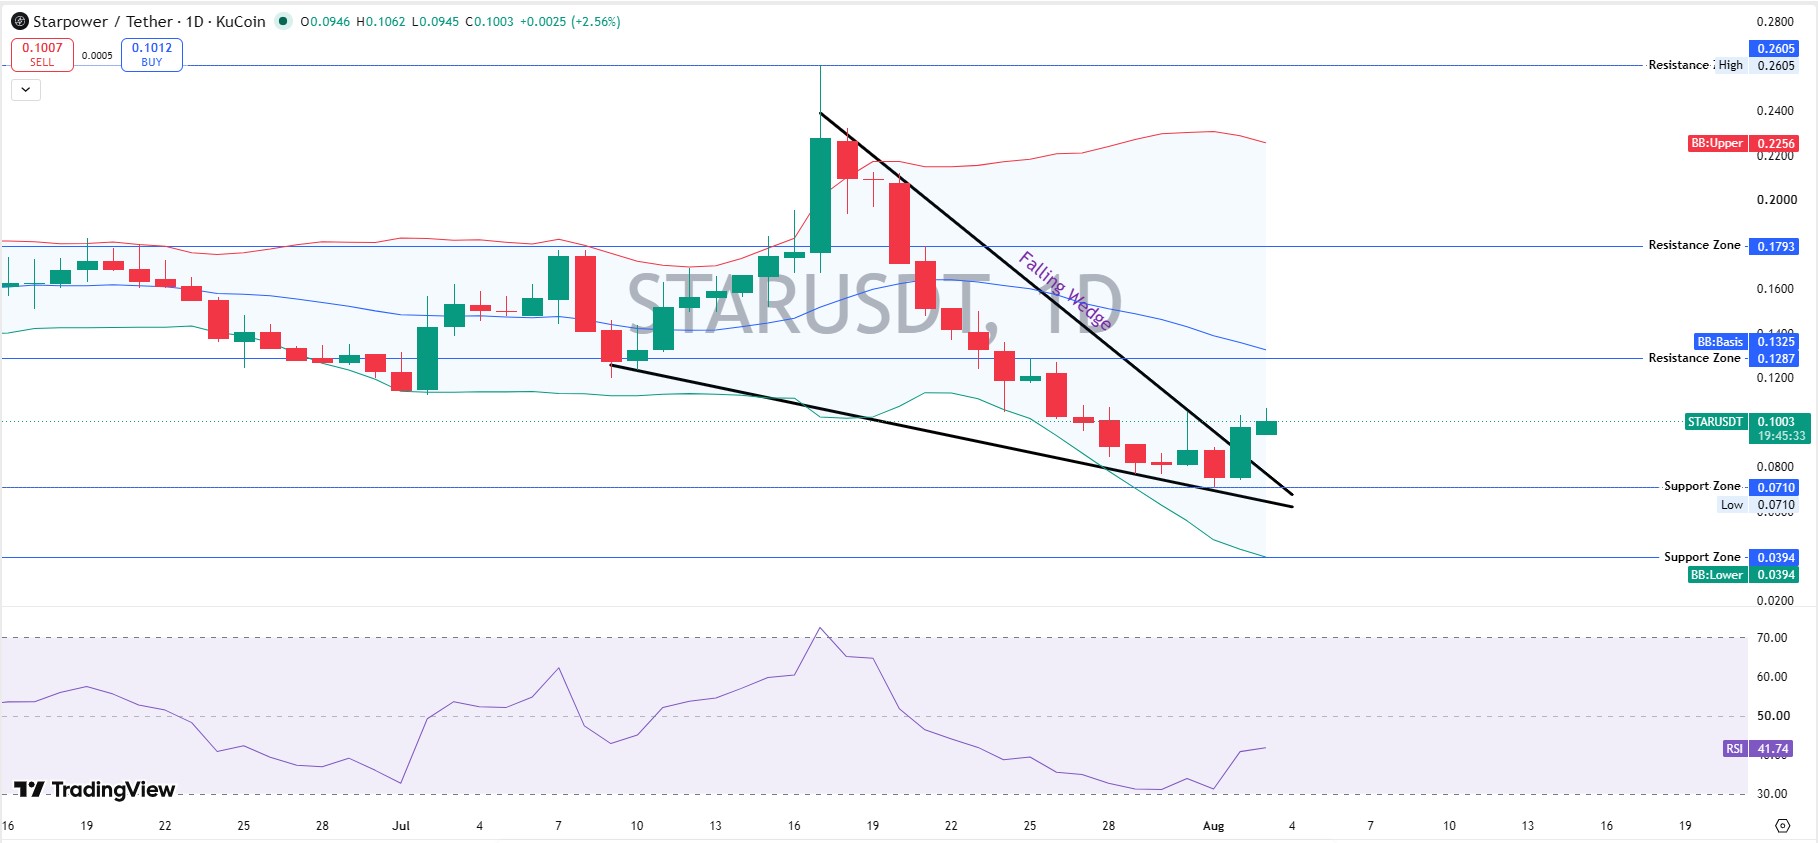
Support sits at $0.0710, with a deeper floor at $0.0394 if that zone gives way.
Daily RSI reads 41.74, still on the cooler side of neutral. When we pulled up the chart, what stood out wasn't the size of today's bounce. It was how close the price still sits to the wedge's lower boundary.
A close back above $0.1287 would confirm the wedge is resolving upward. Losing $0.0710 fast would question that read entirely.
STAR Technical Analysis: Weekly Chart
Zoom out, and the picture gets less friendly. $STAR has spent recent weeks sliding inside a descending channel, dropping from highs near $0.21 in June toward the $0.0710 support zone.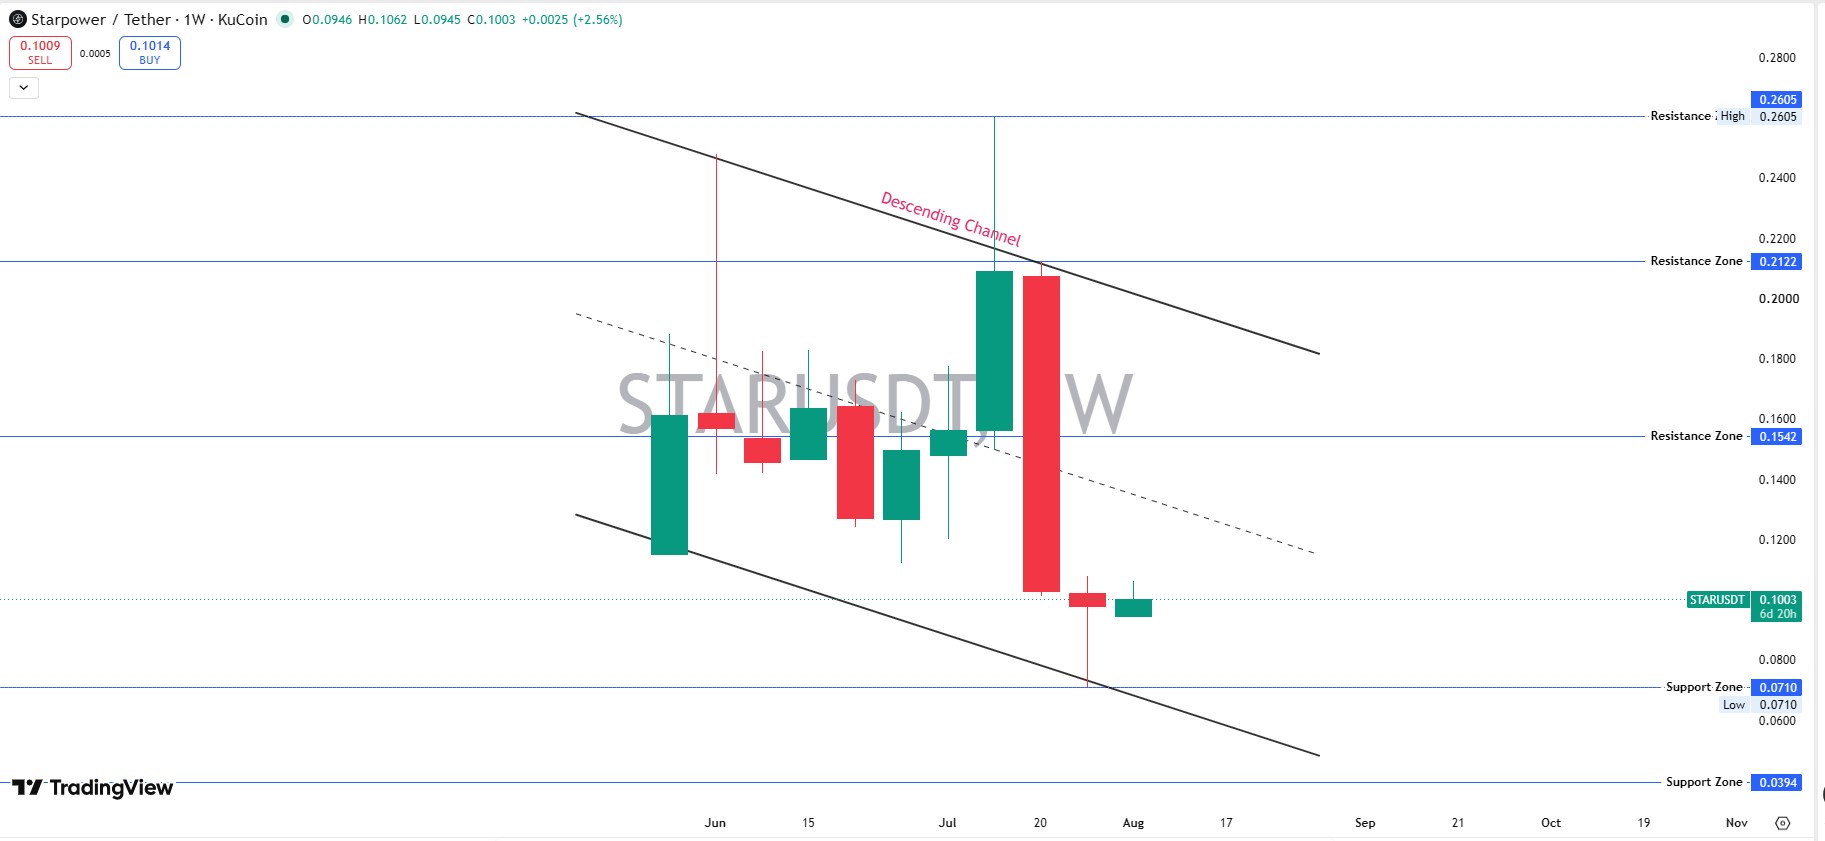
Weekly resistance sits at $0.1542, then $0.2122, then the $0.2605 high.
Here's the thing: the most recent weekly candle closed green, the first real sign of buyers stepping in near channel support. But one candle does not break a multi-week downtrend by itself.
A weekly close above $0.1542 would be the first real signal the descending channel is cracking.
STAR Support And Resistance Levels
Immediate support: $0.0710, then $0.0394.
Immediate resistance: $0.1287, then $0.1793, then $0.2605. A daily close above $0.1793 would confirm the wedge breakout properly.
STAR Price Prediction: Scenarios By Timeframe
Timeframe | Bull Case | Base Case | Bear Case |
24H | Holds above $0.10, tests $0.1287 (moderate) | Chops between $0.09-$0.11 (high) | Slips under $0.0710 (low) |
7D | A daily close above $0.1793 opens $0.2605 (low-moderate) | Range-bound under wedge resistance (high) | A weekly close under $0.0710 confirms breakdown (moderate) |
Aug 2026 | Channel resolves up, targets $0.20-$0.26 (low-moderate) | Drifts $0.07-$0.15 tracking DePIN volume (moderate) | Breaks $0.0394, retests near $0.0372 ATL (low) |
Invalidation for the bullish case is a daily close under $0.0710.
Tokenomics And Whale Concentration
The circulating supply sits near 186.15M STAR against a max supply of 1B, giving a market cap near $18.77M and a fully diluted value near $100.83M, per CoinMarketCap. Liquidity-to-market-cap runs near 7.96%.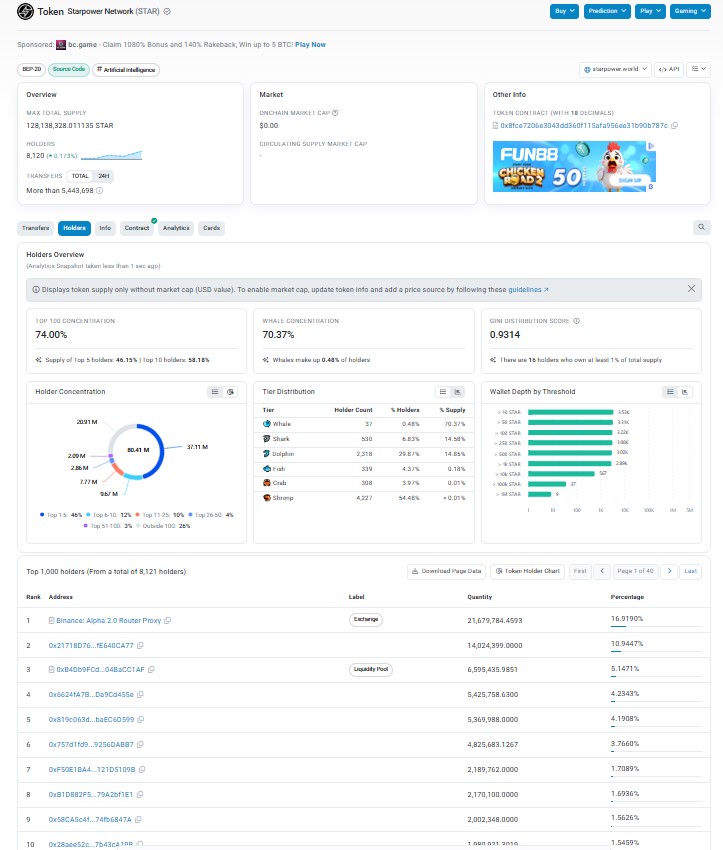
On-chain, concentration runs heavy. Top 100 wallets hold 74.00% of tracked supply, and the top 5 wallets alone hold 46.15%. The Gini distribution score reads 0.9314, deeply skewed toward a small group.
A single Binance-linked router wallet holds roughly 16.9% of tracked supply, with a liquidity pool wallet holding another 5.1%. That fact alone should shape how anyone reads this Starpower price prediction.
Tier | Holder Count | % Holders | % Supply |
Whale | 37 | 0.48% | 70.37% |
Shark | 530 | 6.53% | 14.58% |
Dolphin | 2,318 | 28.55% | 8.85% |
Retail (combined) | 5,235 | 64.44% | 6.20% |
Liquidations And Exchange Volume
Per CoinGlass, 24-hour liquidations hit $69.97K, split between $26.48K in longs and $43.49K in shorts. Short squeezes led the tape today.
Binance carries the heaviest futures volume at $29.21M, with LBank close behind near $12.08M and BingX around $2.05M.
Fine. That's a real, if smaller, derivatives market next to majors like Bitcoin, whose own setup is worth checking on the Bitcoin 2026 outlook page.
STAR And The DePIN Altcoin Narrative
STAR isn't just another small-cap chart. It sits inside the DePIN and AI-energy narrative, a group of tokens tied to decentralized infrastructure networks, and that framing tends to pull in buyers whenever the broader altcoin market turns risk-on.
Compared to majors, DePIN tokens like $STAR often see outsized swings both ways. A 25% daily move on an under-$20M market cap doesn't automatically mean a trend reversal. And this narrative angle is exactly why the STAR DePIN price prediction keyword search keeps growing alongside broader Starpower DePIN coverage.
STAR Market Outlook: Risks To Watch
Whale concentration tops the list, and it's not a small risk here. And a move this fast after weeks of decline invites a sharp retrace.
A break below $0.0710 would put $STAR back on track toward its September 2025 low near $0.0372. That's a real possibility, not a scare tactic.
Macro matters too. A softer Fed rate decision tends to lift risk appetite across small-cap altcoins broadly, $STAR included.
Staying on top of headline risk matters just as much as the chart. Ongoing coverage on the latest crypto news page tends to flag these catalysts before they hit price.
DePIN tokens also tend to cluster with new listings and reward campaigns. It's worth a glance at crypto airdrop trackers before assuming this move stands alone and checking a coin events calendar for anything scheduled around $STAR in the coming weeks.
Methodology: Chart levels came from STAR/USDT daily and weekly charts on KuCoin via TradingView, using RSI-14 and 20-period Bollinger Bands, captured on August 3, 2026, around 14:00 UTC. Price, supply, and market-cap data came from CoinMarketCap and were also captured on August 3, 2026, around 14:00 UTC. Holder and Gini concentration data came from on-chain wallet tracking for contract 0x8fce7206e3043dd360f115afa956ee31b90b787c. Liquidation and volume figures came from CoinGlass.
Disclaimer: This is speculative market commentary, not financial or investment advice. Crypto assets are volatile and can lose most or all of their value. Verify live figures before trading.


















