Stellar Price Prediction: Breakout or Breakdown Next?


Stellar has spent months carving out a large triangle on its chart, the kind of pattern that tends to end with a decisive move rather than more sideways drift.
That backdrop is exactly why this Stellar price prediction matters right now.
With price sitting close to the apex on both the hourly and daily timeframes,
XLM is approaching a point where the next breakout or breakdown could set the tone for weeks ahead.
What Happened Today?
Stellar (XLM) is trading at $0.1831, down 0.91% over the past 24 hours and 1.08% over the past week.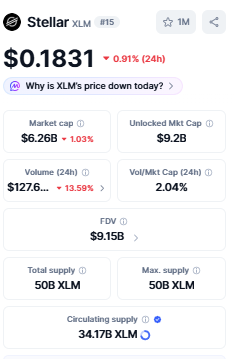
Data Source:coinMarketCap.com
Longer term, the picture is mixed: 30-day change sits at negative 6.18%, 90-day is positive at 5.74%, and XLM is off 8.78% year to date.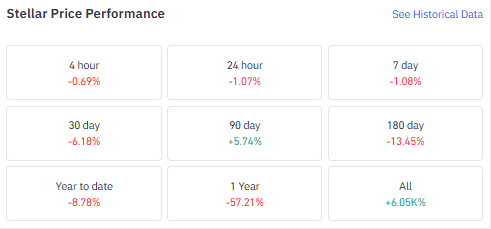
Market cap stands at $6.26 billion, with 24-hour volume at $127.6 million, down 13.59%. FDV is $9.15 billion, and circulating supply sits at 34.17 billion XLM out of a 50 billion max supply.
Data Source: CoinGlass.com
What Is Driving Stellar's Institutional Momentum?
Institutional activity around Stellar continues to expand, with new tokenized asset initiatives, a stronger validator network, and an extended UNDP partnership reinforcing the project's long-term utility.
This kind of steady institutional engagement adds credibility to Stellar's use case beyond speculative trading, though it does not guarantee that XLM's price will react in the short term.
For now, the token is still trading near a key technical decision zone, leaving traders to watch whether these fundamentals can eventually translate into stronger market momentum.
What Is the 1-Hour Chart Showing for Stellar?
XLM is consolidating inside a descending triangle, with price coiling between a flattening support zone near $0.18305 and a downward-sloping resistance trendline.
The range has tightened considerably, with candles compressing as the pattern nears its apex.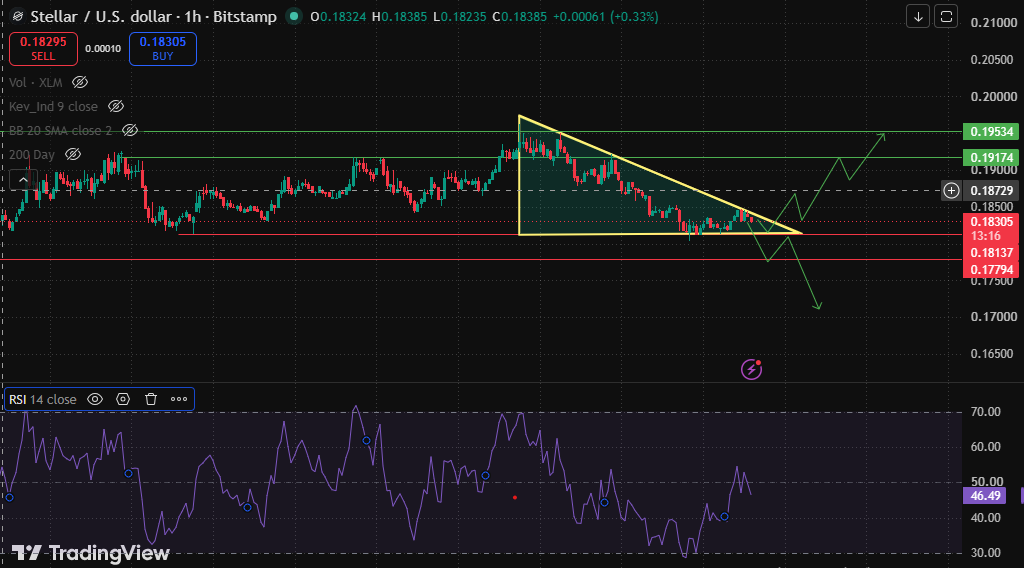
A break above the descending trendline could open the path toward $0.19174, and $0.19534 if momentum builds.
A break below would shift focus toward $0.18137 and then $0.17794.
RSI on the 1-hour chart reads 46.49, sitting in neutral territory, offering no strong directional bias on its own.
With the triangle this tight, the next move is likely to come quickly once either boundary gives way.
What Does the Daily Chart Say About Stellar's Longer-Term Trend?
The daily chart tells a similar story on a bigger scale.
After a sharp spike and subsequent pullback, XLM has been grinding inside a wide descending triangle for months, with lower highs pressing against a support zone near $0.17861.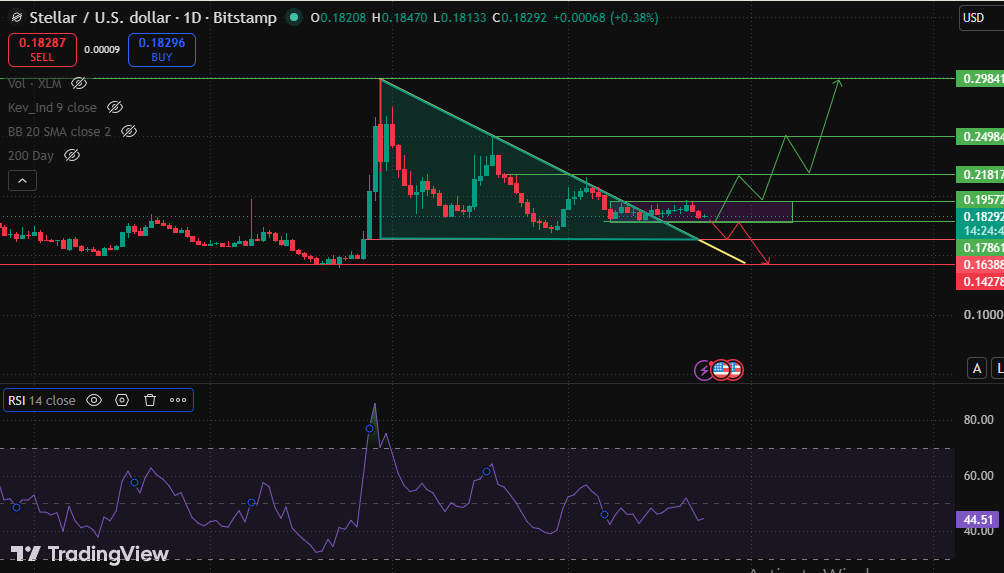
That support has held so far, but the range has narrowed as price approaches the triangle's apex.
A confirmed breakout above the descending resistance trendline could open the door toward $0.19572, then $0.21817, $0.24984, and major resistance at $0.29841.
A breakdown below expose $0.16388 and then $0.14278.
Daily RSI sits at 44.51, in neutral to slightly weak territory, reflecting the extended sideways grind rather than strong momentum in either direction.
Data source: TradingView
What Are Stellar's Derivatives Metrics Signaling?
The OI-weighted funding rate sits at 0.0029%, close to flat, suggesting long/short positioning is fairly balanced.
Open interest stands at $186.62 million, well below the highs above $500 million seen earlier in Stellar's history, pointing to more measured leverage right now.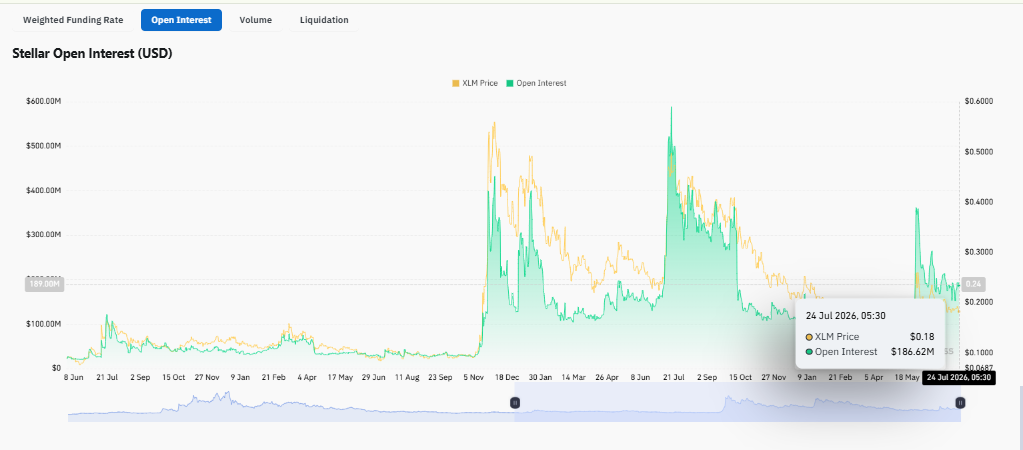
Volume is led by Binance at $48.38 million, followed by MEXC ($26.01M), Bybit ($18.95M), OKX ($14.18M), and BingX ($10.91M).
Liquidations skew heavily toward longs, with $329.66K in long liquidations against just $4.51K in shorts over 24 hours, showing leveraged buyers absorbed most of the recent downside.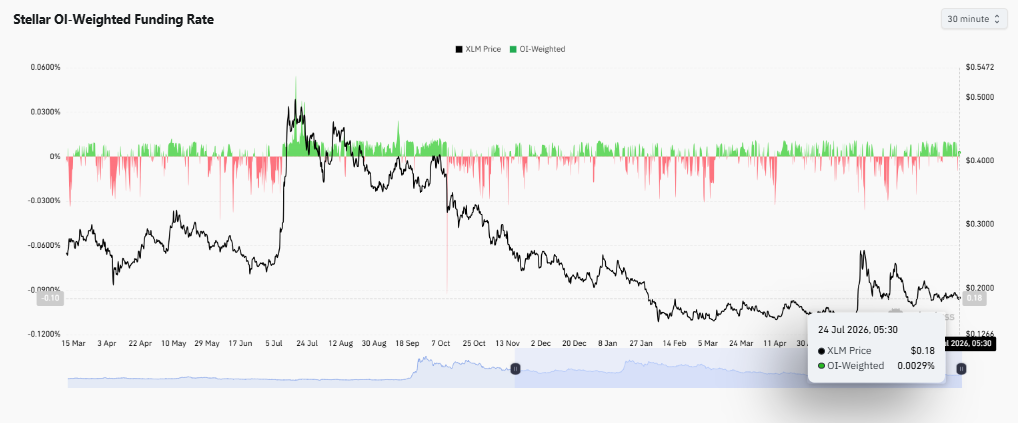
Long/short ratios are mixed: Binance accounts read 0.9048 (slightly short-leaning), OKX reads 1.72 (long-leaning), while Binance's top traders sit at 1.1327 (accounts) and 1.2115 (positions), both leaning long.
Data Soucre: CoinGlass.com
What Do Analysts Think About Stellar's Current Setup?
CoinGabbar analysts Stellar's chart is at a genuine inflection point, with both the hourly and daily timeframes compressing into triangle patterns near their apex.
Funding staying close to neutral and open interest well off its historical highs suggest the market isn't heavily leveraged in either direction right now, even as long liquidations have dominated recent flushes.
That combination often precedes a sharper move once support or resistance gives way, though which direction that move takes is not yet confirmed by the data on hand.
Stellar (XLM) Price Prediction: What Happens Next?
If XLM holds above $0.18305 and breaks the descending resistance trendline, a move toward $0.18729 and $0.19174 becomes more likely, with $0.19534 as a further target.
On the daily chart, clearing $0.19572 would strengthen the case for a run at $0.21817 and beyond.
if $0.18305 fails to hold on the hourly chart and $0.17861 breaks on the daily chart, attention would shift toward $0.18137 and $0.17794 in the short term, and $0.16388 and $0.14278 on the larger timeframe.
Conclusion
Stellar's price action has narrowed into a decision point on both the hourly and daily charts, with support and resistance levels converging after months of consolidation.
Derivatives data shows a relatively balanced market with subdued leverage, leaving the eventual breakout or breakdown to be confirmed by price rather than positioning.
Disclaimer: This article is for informational purposes only and should not be considered financial or investment advice. Cryptocurrency markets are highly volatile, and prices can change rapidly. Readers should conduct their own research and consult a qualified financial advisor before making any investment decisions.
Also read:

















