AKEDO Price Prediction: AKE Rips Higher on Binance Alpha Airdrop Buzz


AKEDO price prediction searches have spiked after AKE jumped roughly 36% in 24 hours to $0.0027, pushing weekly RSI deeply overbought. This AKEDO crypto price prediction breaks down the technicals, tokenomics, and catalysts, with an AKEDO price forecast through 2026, 2027, and 2030. For context on how the wider market is trading right now, see this broader crypto market outlook.
Key Takeaways
-
AKE trades around $0.0027, up 36% in 24 hours (CertiK rating: 4.3).
-
About 16% below its ATH of $0.003244 (late Sep 2025), but up over 1,451% from its ATL of $0.0001743, hit 14 days ago.
-
4-hour RSI reads 70–75; weekly RSI sits above 83; both are overbought.
-
Market cap is near $62.7M versus an FDV of $270.41M; only 22.79B of the 100B AKE max supply circulates.
-
24-hour volume tops $350M, over 5x circulating market cap; liquidity/market cap sits near 1.82%.
-
Holder count is near 42,250, with extreme concentration among top wallets.
-
A Binance Wallet "Alpha Box" airdrop tied to AKEDO and ULTILAND is a fresh catalyst; check the full crypto airdrops calendar for similar upcoming claims.
Why AKEDO Is Back On Traders' Radar
A 337% jump in volume to over $350M signals a sharp spike in interest. Binance dominates futures flow at $552.43M, followed by LBank ($154.97M) and Bybit ($148.69M). Heavy short-side liquidations: $2.93M was wiped out over 24 hours versus $669.15K in longs, suggesting part of the move was a squeeze on top of genuine demand. Live liquidation and open-interest data can be tracked on Coinglass's AKE dashboard.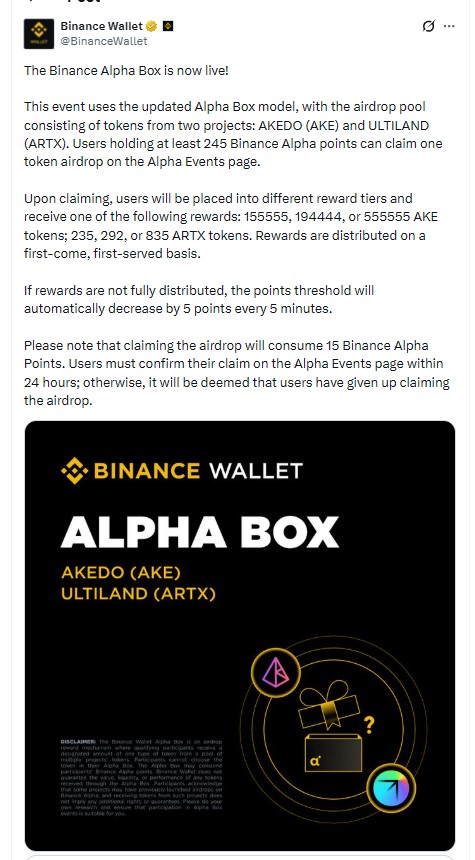
A key driver: Binance Wallet's Alpha Box airdrop, pairing AKEDO (AKE) with ULTILAND (ARTX), first announced via Binance Wallet's official post. Users holding at least 245 Binance Alpha points can claim, first-come first-served, 155,555, 194,444, or 555,555 AKE tokens (or ARTX equivalents), with the threshold dropping 5 points every 5 minutes if unclaimed. Claiming costs 15 Alpha Points and must be confirmed within 24 hours. Traders tracking similar launches may also want to browse the current crypto presale and IDO listings.
Where AKEDO Stands Right Now
AKE last traded near $0.0027, with a 24-hour range between roughly $0.0019 and $0.0027. The circulating supply is 22.79B AKE against a 100B max supply, putting the circulating market cap near $62.7M and FDV near $270.41M, a wide dilution gap with over three-quarters of the supply still unreleased.
The all-time high of $0.003244 was set in late September 2025, so the price is still about 16.65% below that peak. The all-time low of $0.0001743 was hit only 14 days ago; this rally is a sharp recovery off a very recent bottom, not a fresh push into price discovery. This pattern of sharp bottoms followed by fast recoveries has also shown up recently in Solana's price action.
AKEDO Price Analysis: 4-Hour Chart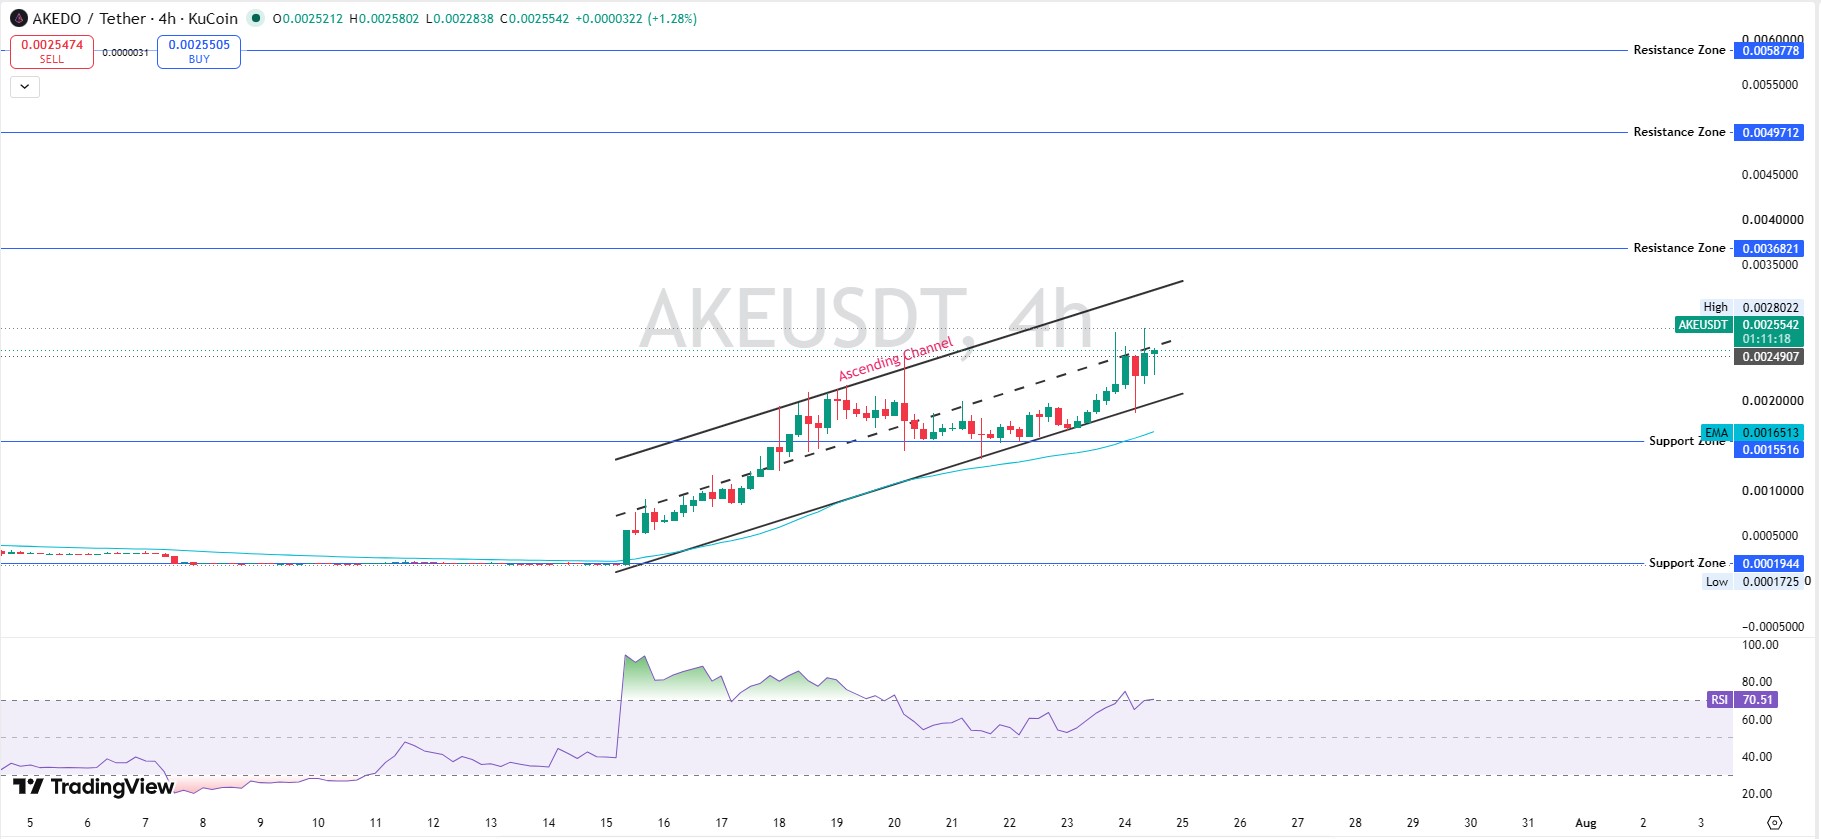
The 4-hour AKE/USDT chart shows price climbing inside a rising channel, breaking above a multi-day base after grinding along support near the $0.0016 EMA. RSI here reads 70–75, meaningfully overbought, raising the odds of near-term cooling within an intact uptrend. Traders can follow the live setup on TradingView's charting terminal.
Support and Resistance (4H)
| Level | Price |
|---|---|
| Resistance 3 | $0.0058778 |
| Resistance 2 | $0.0049712 |
| Resistance 1 | $0.0036821 |
| Current Price | $0.0026 |
| Support 1 (EMA) | $0.0016513 |
| Support 2 | $0.0015516 |
AKEDO Technical Analysis: Weekly Chart
The weekly chart is more dramatic: AKE broke out of a months-long ascending-triangle base, posting a 28% weekly gain and a fresh multi-month high.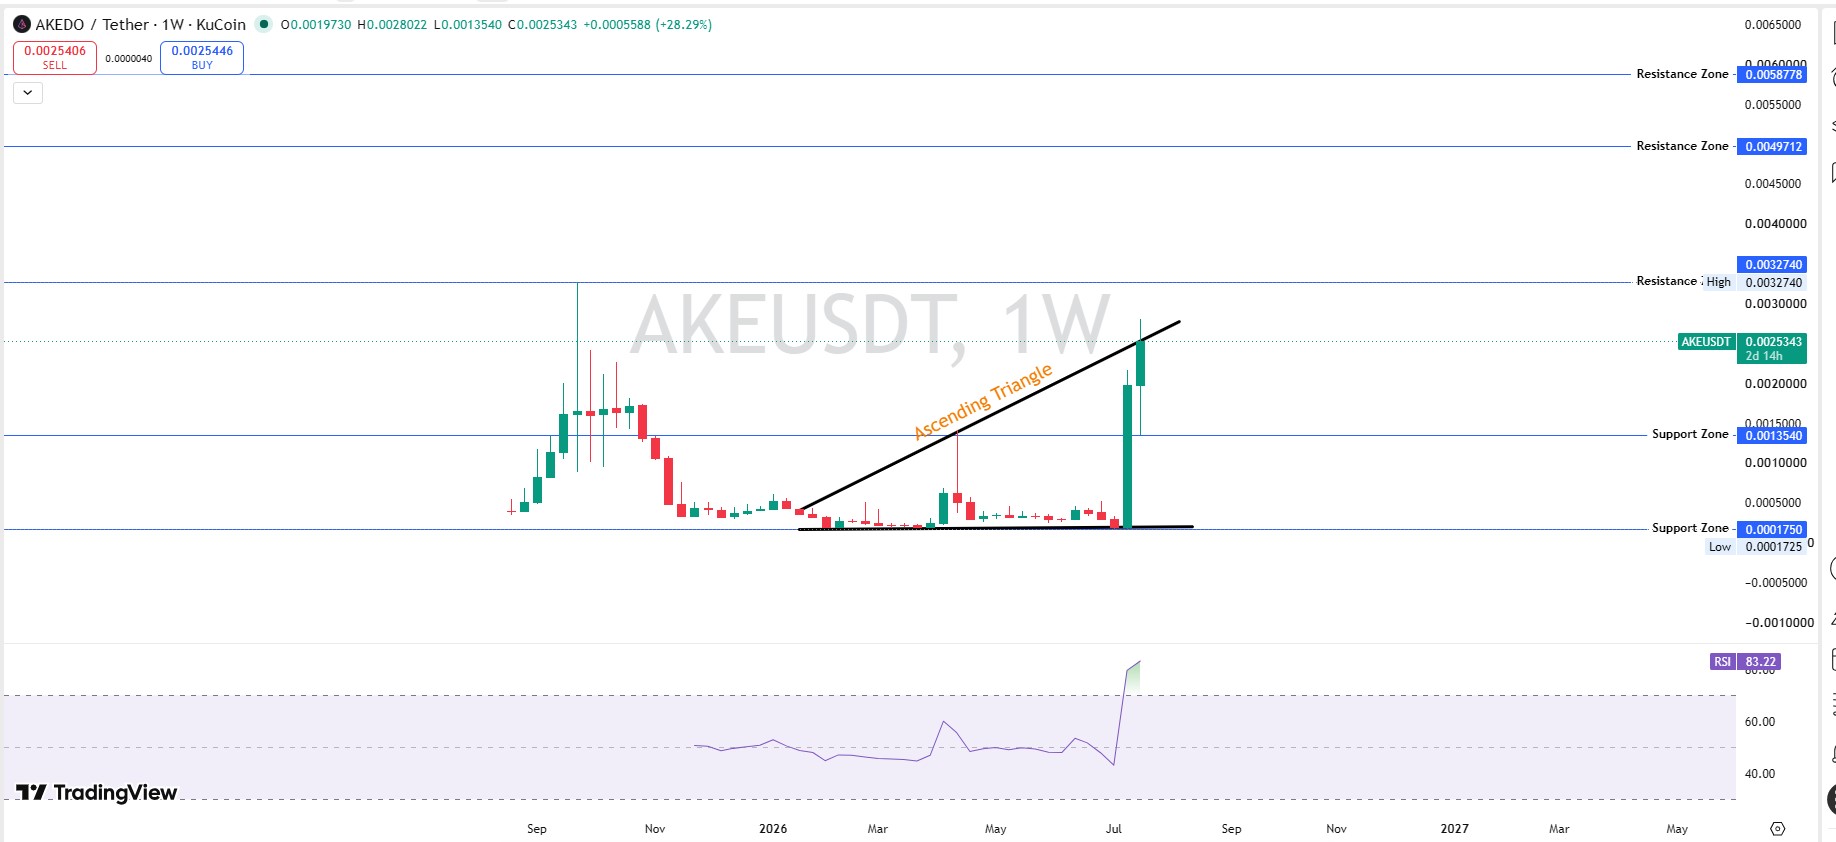
Weekly RSI above 83 is extremely overbought, which typically precedes consolidation or a pullback even in strong uptrends. This kind of overbought breakout mirrors the setup covered in our Bitcoin price forecast, where similar RSI extremes preceded a cooling phase.
Support and Resistance (Weekly)
| Level | Price |
|---|---|
| Resistance 2 | $0.0058778 |
| Resistance 1 | $0.0049712 |
| Recent High | $0.0032740 |
| Current Price | $0.0025 |
| Support 1 | $0.0013540 |
| Support 2 | $0.0001750 |
AKEDO Tokenomics and Holder Concentration
On-chain data shows AKE's top 100 wallets control 98.82% of supply, and whale wallets (1.93% of holders) hold 99.96% of all tokens. The Gini score sits at 0.9992, with 18 wallets holding at least 1% of supply each.
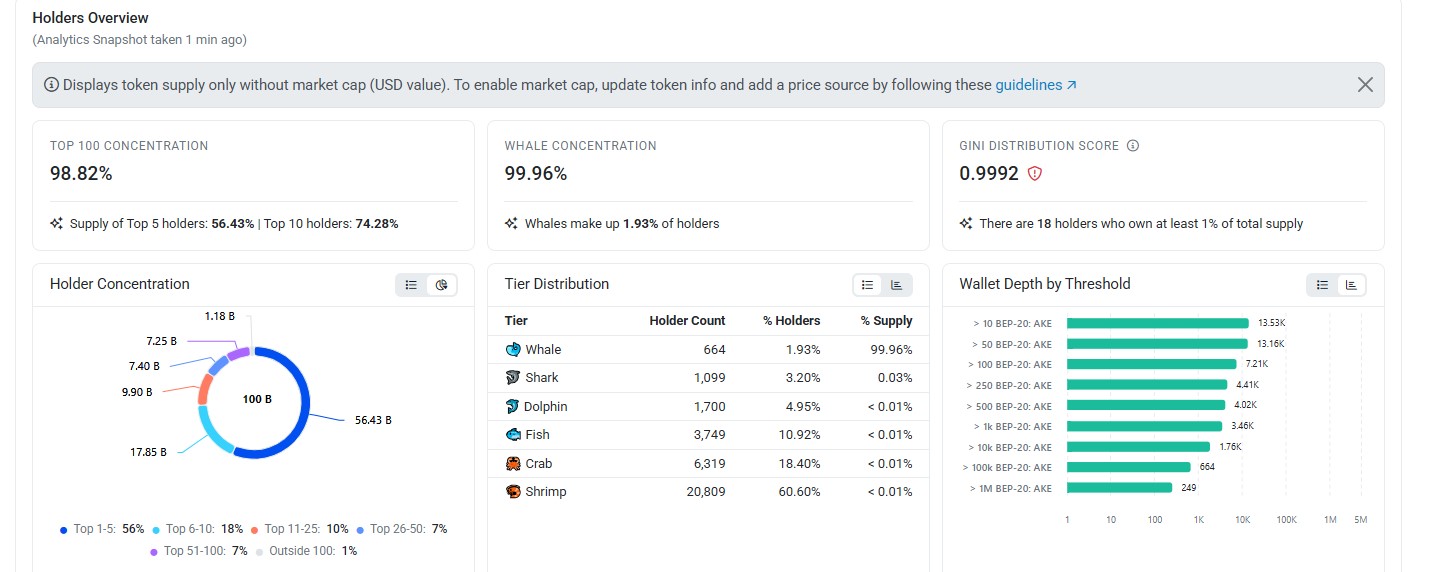
The two largest wallets alone hold 18.4% and 15%, followed by Binance's Alpha router proxy (5.5%) and Gate's exchange wallet (3.2%), rounding out a top-10 dominated by unlabeled wallets. Full wallet-by-wallet distribution is viewable on BscScan's AKE holder list.
Liquidity and Volume
Liquidity relative to market cap sits at about 1.82%, thin against $350M+ in daily volume; larger orders can move price more than spot depth suggests. 24-hour liquidations reached $3.60M, with shorts absorbing most losses. For a wider view of where futures flow is concentrated across majors right now, see this Bitcoin and Ethereum flow comparison.
AKE Price Prediction: Bull, Base, and Bear Scenarios
Bull (30%): A break above $0.0037 opens a path toward $0.0050, on continued Alpha Box hype and listing momentum.
Base (45%): Price consolidates $0.0020–$0.0033 as overbought RSI cools.
Bear (25%): Momentum fades, retracing toward $0.0016–$0.0018 support.
For a look at how a similar bull/base/bear framework plays out on a large-cap asset, see our Bitcoin bull/bear base case.
Short-Term AKEDO Price Target
| Timeframe | Bear | Base | Bull |
|---|---|---|---|
| 24H | $0.0022 | $0.0026 | $0.0030 |
| 7D | $0.0018 | $0.0025 | $0.0037 |
| 30D | $0.0013 | $0.0022 | $0.0050 |
AKEDO Price Prediction: 2026, 2027, 2030
| Year | Bear | Base | Bull |
|---|---|---|---|
| 2026 (Year-End) | $0.0008 | $0.0022 | $0.0048 |
| 2027 | $0.0005 | $0.0030 | $0.0075 |
| 2030 | $0.0003 | $0.0045 | $0.0130 |
These are directional scenarios, not guarantees, given AKEDO's short trading history and heavy supply concentration. Readers comparing long-range forecasts across majors can also check the Ethereum price outlook for 2026 and the XRP price target analysis.
Key Risks
-
Overbought momentum: RSI above 83 (weekly) raises pullback odds.
-
Extreme concentration: A 0.9992 Gini score means a few wallets can move the market.
-
Thin liquidity: A 1.82% liquidity-to-market-cap ratio against heavy volume raises slippage risk.
-
Airdrop-driven flow: Alpha Box claims could add selling pressure once tokens unlock.
Similar low-cap, high-concentration tokens have shown sharp reversals during broader market stress; see how altcoins reacted during the Iran truce crypto market crash for a comparable risk pattern.
Glossary
RSI: Momentum indicator; above 70 signals overbought.
FDV: Market cap if all tokens circulated.
Gini Score: Supply concentration measure; closer to 1 means more unequal distribution.
For more forecasts like this one, browse the full price prediction hub or track upcoming catalysts on the crypto events calendar.
Disclaimer: This article is for informational purposes only and does not constitute financial advice. Cryptocurrency markets are highly volatile. Always do your own research and consult a licensed financial advisor before making investment decisions.

















