SUI Under $1 Today, $30 By 2026 — Sui Price Prediction Explained


Sui price prediction chatter is picking up steam again, and there is a good reason for it.
This coin has done something twice now that traders watch closely, and just as that setup develops, a bold call from within the $SUI community is making the rounds suggesting this token could be worth dramatically more before the year is even out.
Between the chart and the conversation happening around it, $SUI feels like it is standing right at a decision point. Here is the full picture.
Sui Price Today: Live Data and 24-Hour Change
Coin is trading at $0.8082 at last check, up 1.71% on the day and adding roughly $0.0136 in value.
That kind of gain on a day like this suggests buyers are stepping in rather than sitting on the sidelines.
Futures volume over the past 24 hours sits at $937.36 million against spot volume of $165.79 million, showing that a meaningful chunk of today's move is coming from leveraged traders positioning around current levels.
Sui's market cap currently stands at $3.26 billion, with open interest at $698.90 million, a fairly substantial amount of exposure for a coin trading under a dollar.
Circulating supply is at 4.09 billion $SUI against a total and max supply of 10 billion, meaning there is still a large chunk of tokens yet to enter.
circulation over time, something long-term $SUI forecast watchers tend to keep in mind alongside price action.
Source: CoinGlass, SUI market data, accessed September 7, 2026.
Sui Community Voice Calls For 30 Dollars By End Of 2026
Away from the chart, there is a conversation happening in the Sui community that is worth paying attention to, even if it needs to be read with a healthy dose of caution.
A post from the account Sui Insiders on X argued that buying $SUI under one dollar today feels similar to buying Bitcoin at ten dollars in its early days, framing it as a conviction call rather than a technical forecast.
The post went further, stating plainly that $SUI could reach 30 dollars before the end of 2026, describing the outcome as, in their words, hard-coded into the project's trajectory.
That kind of target would represent an enormous multiple from where $SUI sits today, and it is important to be clear that this is one account's personal conviction and community sentiment, not a guaranteed outcome or anything backed by a formal price model.
Bold calls like this tend to spread quickly because they are exciting to imagine, and they can genuinely influence short-term sentiment and buying behavior even when the underlying math is a stretch.
For anyone building their own Sui price outlook, it is worth separating the enthusiasm from the actual technical picture unfolding in real time.
Source: Post by Sui Insiders (@SuiInsiders) on X.
Quick Take: SUI Price Action At A Glance
CMP: $0.8080 (4-hour chart, Binance)
Price is taking support from an ascending trendline for a second retest, after the first retest produced a fresh higher high
4-hour trigger: sustained close above 0.8059 opens the path toward 0.9541, then major resistance 1.1647
Failure level: close below 0.6967 risks a slide toward 0.6351
Momentum oscillator carries a bearish tag despite the daily gain, currently reading 59.84
Data timestamp: September 7, 2026, 4h Binance perpetual chart
Risk note: open interest is elevated relative to spot volume, so a sharp move in either direction could get exaggerated by leveraged positioning
Sui Technical Analysis: SUI as Bitcoin in 2026
Looking at the 4-hour SUI to TetherUS perpetual chart on Binance, the coin has been climbing steadily while taking support from an ascending trendline that has now been tested twice.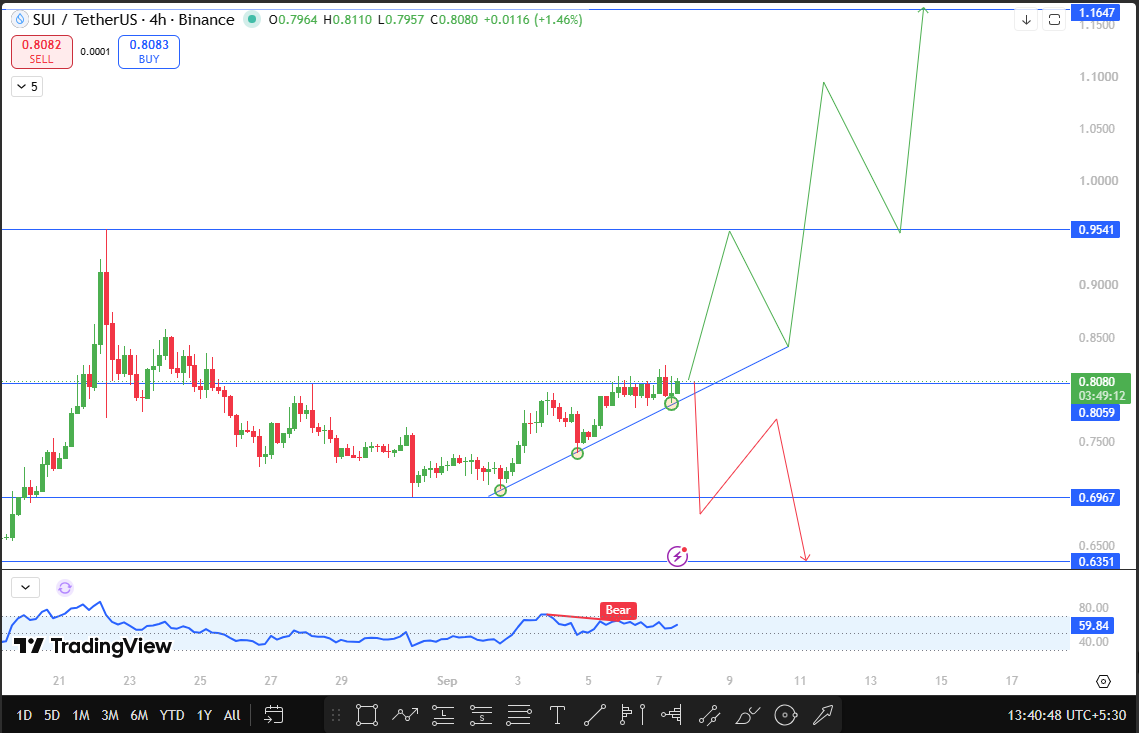
The first retest of this line produced a fresh higher high, a healthy sign for anyone tracking Sui trend analysis, and the price has now come back down to touch the same trendline a second time near current levels around $0.8080.
The momentum oscillator on the chart is sitting at 59.84 and carries a bearish tag, which suggests short-term momentum has cooled slightly even as the broader structure remains constructive.
This kind of pause during a second trendline retest is common and does not by itself signal a trend change.
The level that matters most right now is $0.8059. If SUI manages a 4-hour close that sustains above this zone, the chart opens up toward $0.9541 as the next resistance, an area that would represent a meaningful step higher for anyone following SUI technical analysis closely.
Beyond that, the major resistance target sits at $1.1647, a level that lines up with the kind of extended move this trendline structure has been building toward across its recent legs higher.
A move of that size would likely still come with pullbacks along the way rather than one continuous climb, based on how the earlier legs of this uptrend have behaved.
On the downside, if this second retest fails and SUI closes below $0.6967, that would break the ascending trendline structure that has held since late August.
In that scenario, the next support to watch is $0.6351, a level the chart has clearly flagged as the next real floor if sellers take over.
Source: TradingView, SUI/USDT Perpetual, Binance, 4h chart, accessed September 7, 2026, 1:40 UTC+5:30.
Sui Support and Resistance Levels to Watch
Level Type | Price | Distance From CMP |
Major Resistance | $1.1647 | +44.1% |
Resistance 2 | $0.9541 | +18.1% |
Resistance 1 | $0.8059 | -0.3% |
Current Price | $0.8080 | — |
Support 1 | $0.6967 | -13.8% |
Major Support | $0.6351 | -21.4% |
Bull Case, Base Case, And Bear Case For SUI
The bullish path here looks fairly encouraging on paper.
If Price holds this trendline for a second time and pushes through $0.8059 with real conviction, $0.9541 becomes the next realistic stop, and a further breakout could eventually put $1.1647 within reach over time.
The community enthusiasm circulating right now, even if the specific 30-dollar target is a stretch, could add extra buying interest if the technical breakout actually confirms.
The base case would have SUI spending more time coiling around this trendline zone, perhaps testing it a third time before making a decisive move. Given the current momentum reading sitting just above neutral, some sideways churn here before a real breakout would not be unusual.
The bearish case comes into play if this trendline finally cracks. A close below $0.6967 would break a structure that has held for weeks, and that kind of failure would likely open the door to a deeper slide toward $0.6351, especially if broader market sentiment turns sour at the same time.
Risks To This Sui Price Prediction
The 30-dollar community target getting attention right now is speculative conviction, not a data-backed forecast, and treating it as a near-term expectation would be a mistake regardless of how it spreads online.
Elevated open interest relative to spot volume also raises the odds of a sharp, leverage-driven move in either direction that could overshoot what the chart structure alone would suggest.
Wider crypto market conditions matter as well, since a shift in Bitcoin or overall risk appetite could easily disrupt this trendline setup no matter how constructive it looks in isolation today.
Key Terms Explained
Ascending Trendline: A rising support line connecting a series of higher lows, used to judge whether an uptrend structure remains intact through pullbacks.
Open Interest: The total value of outstanding derivative contracts that remain unsettled, often used as a gauge of how much leveraged money is active in a market.
Circulating Supply: The number of coins currently available and trading in the market, as distinct from the total or maximum supply that will eventually exist.
Disclaimer
This article is for informational purposes only and should not be taken as financial advice. Cryptocurrency markets are highly volatile, and price predictions, including community sentiment and social media targets, are speculative and not guaranteed outcomes. Always conduct your own research before making any investment decisions.
Also read:

















