BONER Price Prediction 2026-2030: Next Target, Support, and Resistance


$BONER (Boner Coin), the meme token on the Robinhood Chain ecosystem, is trading near $0.0603 after a wild 24 hours that saw it jump over 100% before slicing back down. This BONER price prediction covers where it stands now, what the chart says, and where it could go by 2026, 2027, and 2030. Immediate resistance sits close to $0.0877, and support forms around $0.0464. Let's get into it.
BONER Price Prediction Today
Snapshot below, pulled from multiple trackers in the same short window, so small gaps between sources are normal. Follow the live feed on the GeckoTerminal BONER pool chart.
Current price: around $0.0603 (GeckoTerminal); CoinGecko shows $0.05971, and Robinhood Chain Explorer shows $0.063519.
24H change: +106.5% to +115.08% depending on source
Market cap: roughly $59.8M to $64M
24H trading volume: approximately $10.5M to $40.2M
All-time high: $0.08367, hit September 07, 2026
All-time low: $0.02394, hit September 06, 2026
Circulating supply: around 999,999,926 BONER, near total supply of 1,000,000,000
Chain: Robinhood Chain (Uniswap V4 pool)
Contract: 0x98096d17e191b3da1d5f99a6d7b3584351b11e18
Current trend: bullish structure short-term, cooling off from the intraday top
The token is only six days old. And that matters. Young meme coins move fast both ways, so treat every number here as a moving target.
BONER Price Prediction: Bullish or Bearish?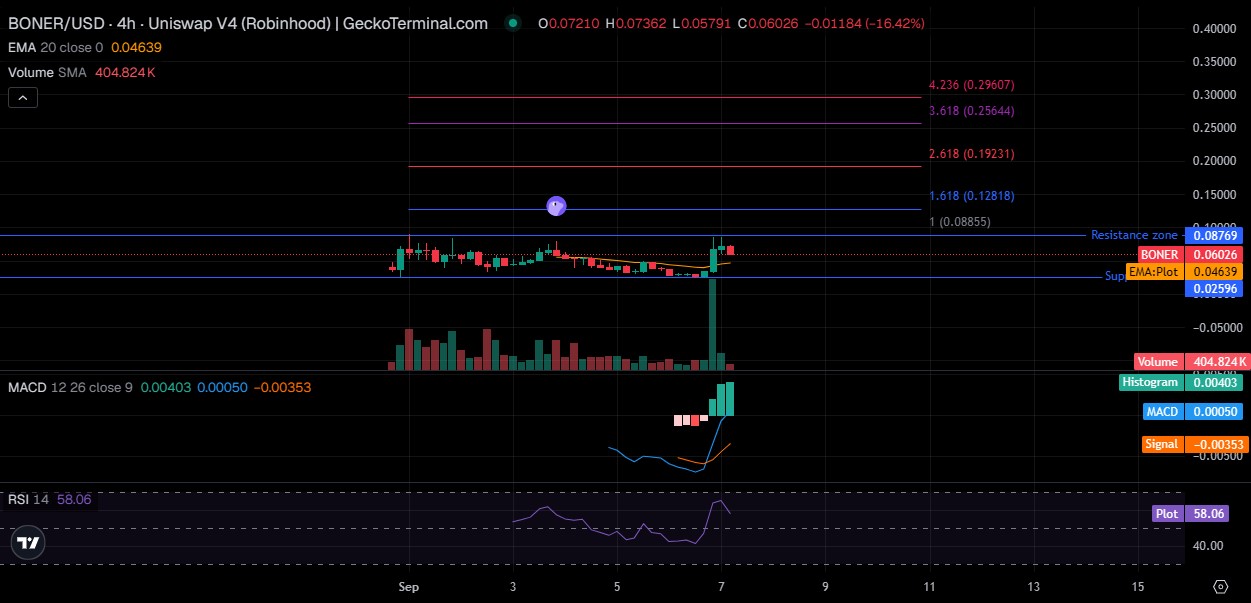
Right now, the setup leans cautiously bullish, not euphoric. The 4-hour chart shows a token that ripped from under $0.03 to above $0.073, got rejected, and is now consolidating above its 20-period EMA.
RSI sits at 58, neutral to mildly bullish, not overbought. The MACD flipped positive with the histogram expanding. Real signal, not noise. But the sharp -16.42% pullback on the latest candle shows sellers active near the highs, keeping this from a clean breakout story yet.
Current Price Structure
Trading action is stuck between the 20 EMA near $0.0464 and the resistance zone near $0.0877. That's the battlefield right now.
RSI Analysis
The 14-period RSI reads 58.06. Nothing extreme. Room to run before overbought, but no strong exhaustion signal either.
MACD Analysis
The MACD line sits at 0.00050, above the signal line at -0.00353, and the histogram at 0.00403. That's a bullish crossover in progress. When we pulled up the MACD, what stood out was how fresh it was; it just turned positive.
Trading Volume
Volume SMA reads near 404.8K on the chart, and 24-hour trading volume across the live pool ranges from ten to forty million dollars depending on the aggregator. Heavy activity for a six-day-old token.
Short-Term Trend
Up, but choppy. One sharp red candle wiped out a chunk of gains in a single 4-hour window. That's meme-launch nature. Traders chasing green candles got caught.
BONER Support and Resistance Levels
This is where a lot of price prediction pieces get lazy. We're not doing that here; every level below connects to what happens if it breaks.
Key Support
The 20 EMA near $0.0464 is the first real support. Below that, the all-time low of $0.02394 is the last line of defense.
Immediate Resistance
The resistance zone around $0.0877 has already rejected trading twice. That's the level bulls need to clear. Watch it live on CoinGecko's Boner Coin page.
Major Breakout Level
A confirmed trade above $0.0877 with rising volume opens the door toward the 1.618 Fibonacci extension at $0.12818.
Bearish Invalidation Level
If trading falls and holds below $0.0464, the bullish structure is broken. A drop back under $0.02394 invalidates the entire recovery thesis.
BONER Price Prediction for 2026
Bear case: $0.02 to $0.03 if meme-coin interest fades and liquidity thins out.
Base case: $0.05 to $0.09 through year-end, mirroring current chop.
Bull case: $0.12 to $0.15 if the $0.0877 zone breaks with volume support.
Year-end target: $0.07 to $0.10 feels like the realistic middle ground. See how other tokens are shaping up in the price prediction coverage.
BONER Price Prediction 2027
By 2027, this stops being about one candle and starts being about whether Robinhood Chain builds a real ecosystem. More paired tokens, more liquidity, more transaction volume, and this BONER price prediction gets a lot healthier.
Stay a niche experiment, and $BONER fades like most meme launches do. Assuming moderate ecosystem growth and holder retention above 15,000 wallets, $0.03 to $0.20 is plausible. Wide range, we know. That's meme-coin forecasting. Incentive programs tracked on the crypto airdrops page often drive holder growth at this stage.
BONER Price Prediction 2030
Looking to 2030 means stacking assumptions on assumptions.
Market cap scenario: $500M cap implies roughly $0.50; $1B implies close to $1.00
Adoption: requires Robinhood Chain becoming a genuinely used network
Ecosystem: more DeFi pairs and deeper liquidity than today's thin $1.3M pool
Market backdrop: needs a sustained crypto bull cycle broadly
None of this is guaranteed. Most meme coins from any given year never see the next cycle.
What Could Drive BONER Higher?
Robinhood Chain Growth
More chain users means more wallets browsing whatever's trending, and $BONER sits near the top right now. The memecoin news section tracks similar launches worth comparing.
Liquidity Expansion
The pool sits near $1.3M, thin by any standard. Deeper liquidity means big orders don't crater price, which draws in buyers currently avoiding the slippage.
Exchange/Market Access
$BONER trades through a single Uniswap V4 pool right now. Additional listings would widen the buyer base fast. Worth checking the exchange listing tracker periodically for new venues.
Meme-Coin Sentiment
Meme coins move in waves as a category. BONER's recent 100%-plus move lines up with exactly this kind of sector-wide appetite.
Whale Demand
Large wallets already hold a meaningful slice of supply. If they keep buying instead of distributing, float tightens and gains become easier to hold.
What Could Push BONER Lower?
Liquidity Risk
A $1.3M pool cuts both ways. Large sell orders can crater prices fast, and that risk doesn't disappear just because the trend looks positive today.
Whale Selling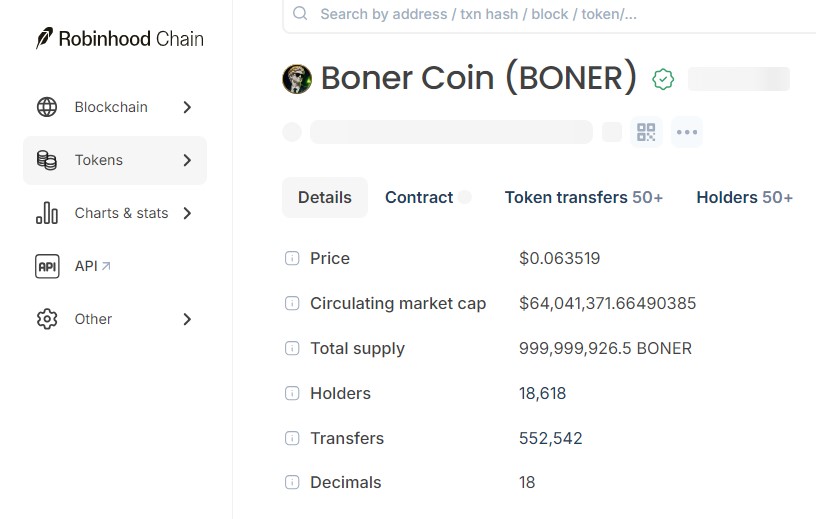
The top 10 wallets hold 20.39% of the total supply. A coordinated exit would overwhelm current liquidity fast. Worth tracking on the Robinhood Chain explorer, which shows live holder balances.
Loss of Momentum
Meme coins run on attention. Once the chart stops making headlines, volume dries up fast, and thin volume makes every move choppier.
Broader Crypto Weakness
Meme tokens sit furthest out on the risk curve. When Bitcoin sells off, capital flees the riskiest assets first, and $BONER feels it before large-cap coins even start moving.
BONER vs Bitcoin: Does BTC Direction Matter?
Yes, eventually. A token this new mostly trades on its own hype, disconnected from Bitcoin's daily moves. But that decoupling doesn't last. When Bitcoin dominance rises, capital rotates out of small-cap meme plays. $BONER is wildly outperforming BTC right now, normal for a six-day-old token. Does that survive once the launch euphoria fades? Open question.
BONER Bull, Base and Bear Scenarios
Scenario | Conditions | Target | Invalidation |
Bull | Breakout above $0.0877 with rising volume | $0.12 to $0.15 | Falls back below $0.0877 |
Base | Continued consolidation in current range | $0.05 to $0.09 | N/A, range holds |
Bear | Support at $0.0464 fails to hold | $0.02 to $0.03 | Trading below $0.02394 |
BONER Trader Takeaway
Keep it simple.
Bullish above: $0.0464
Breakout confirmation: $0.0877 with volume
First target: $0.12818
Major resistance: $0.0877 zone
Bearish below: $0.0464
Invalidation: $0.02394
Trading above the EMA keeps the bulls in control. Losing it flips the script fast. Keep it on your watchlist alongside the coin events calendar, since one announcement can shift these levels overnight.
Disclaimer
This article is for informational purposes only and does not constitute financial, investment, or trading advice. Cryptocurrency markets, especially newly launched meme tokens, are highly volatile and carry significant risk of loss. Prices and data referenced here reflect data taken on September 07, 2026, and can change rapidly. Always do your own research and consult a licensed financial advisor before making any investment decisions.
Also read:

















