Sui Price Prediction: $SUI Breakout or Bull Trap? The Next Big Move?


SUI just broke down from the ascending trendline it had been riding since late July, and leveraged longs are already paying the price.
This Sui Price Prediction looks at whether the current consolidation holds or gives way to further downside, with the bullish case needing a close back above $0.70003 in the next few days, while a break below $0.67069 would confirm the breakdown has more room to run.
Market data was checked on August 14, 2026, at 14:52 IST.
SUI Price Prediction Today: Market Overview
Metric | Value |
Price | $0.67975 |
24h Change | -1.24% |
Market Cap | $2.76B |
Unlocked Market Cap | $2.76B |
FDV | $6.79B |
24h Volume | $117.02M |
Vol/Mkt Cap (24h) | 4.21% |
Total Supply | 10B SUI |
Max Supply | 10B $SUI |
Circulating Supply | 4.07B $SUI |
Source: Data from CoinMarketCap as of August 14, 2026, at 14:52 IST. Figures may vary slightly across other tracking websites.
SUI Liquidation and Volume Data
Window | Total Rekt | Long | Short |
1h | $631.75 | $631.75 | $0 |
4h | $94.03K | $93.51K | $518.03 |
12h | $105.02K | $104.40K | $622.96 |
24h | $553.05K | $549.72K | $3.33K |
Long liquidations account for nearly all of the total across every window, showing leveraged buyers have been repeatedly caught out during the trendline breakdown and the consolidation that followed.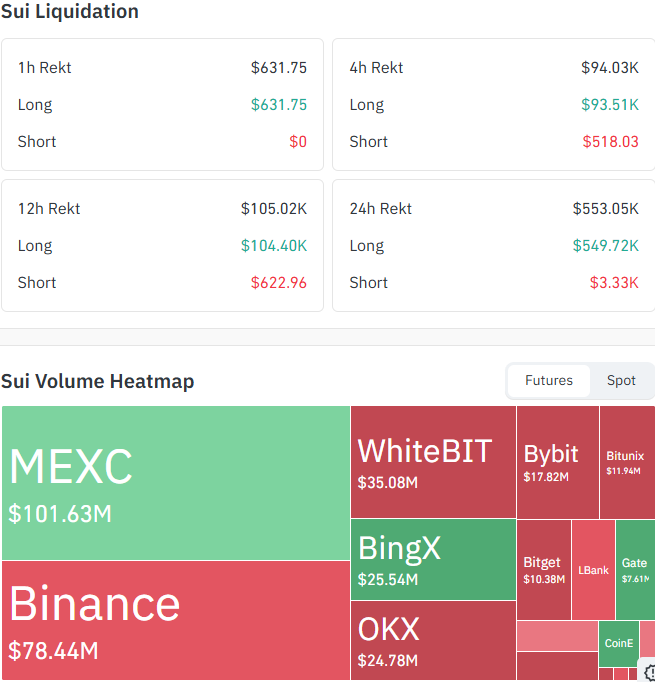
Source: Data From CoinGlass
Exchange Volume (Futures)
Exchange | Volume |
MEXC | $101.63M |
Binance | $78.44M |
WhiteBIT | $35.08M |
BingX | $25.54M |
MEXC and Binance together account for the bulk of visible futures volume, with activity spread thinly across the rest of the exchanges tracked.
Note: Futures data from Coinglass, kept separate from the spot volume figures above.
SUI Price Prediction Chart: Technical Analysis
Pair: SUI/USD · Market: Spot (Crypto) · Timeframe: 4H · Source: TradingView · Timestamp: August 14, 2026, 14:52 UTC+5:30
SUI is trading at $0.67975, after breaking down from the ascending trendline it had held since late July.
Price fell sharply off that break and has since settled into a tight consolidation range just below the EMA cluster.
RSI (Relative Strength Index, a momentum reading that shows if an asset is overbought or oversold) sits at 43.58, leaning weak but not oversold, which fits a market that's pausing rather than reversing hard either way.
EMA (Exponential Moving Average, a trend indicator that gives more weight to recent price action) 20 sits at $0.68541, and EMA 50 sits at $0.68699, both just above the current price and capping the consolidation from above.
Let’s see which side the consolidation breaks and whether it triggers the next big rally. 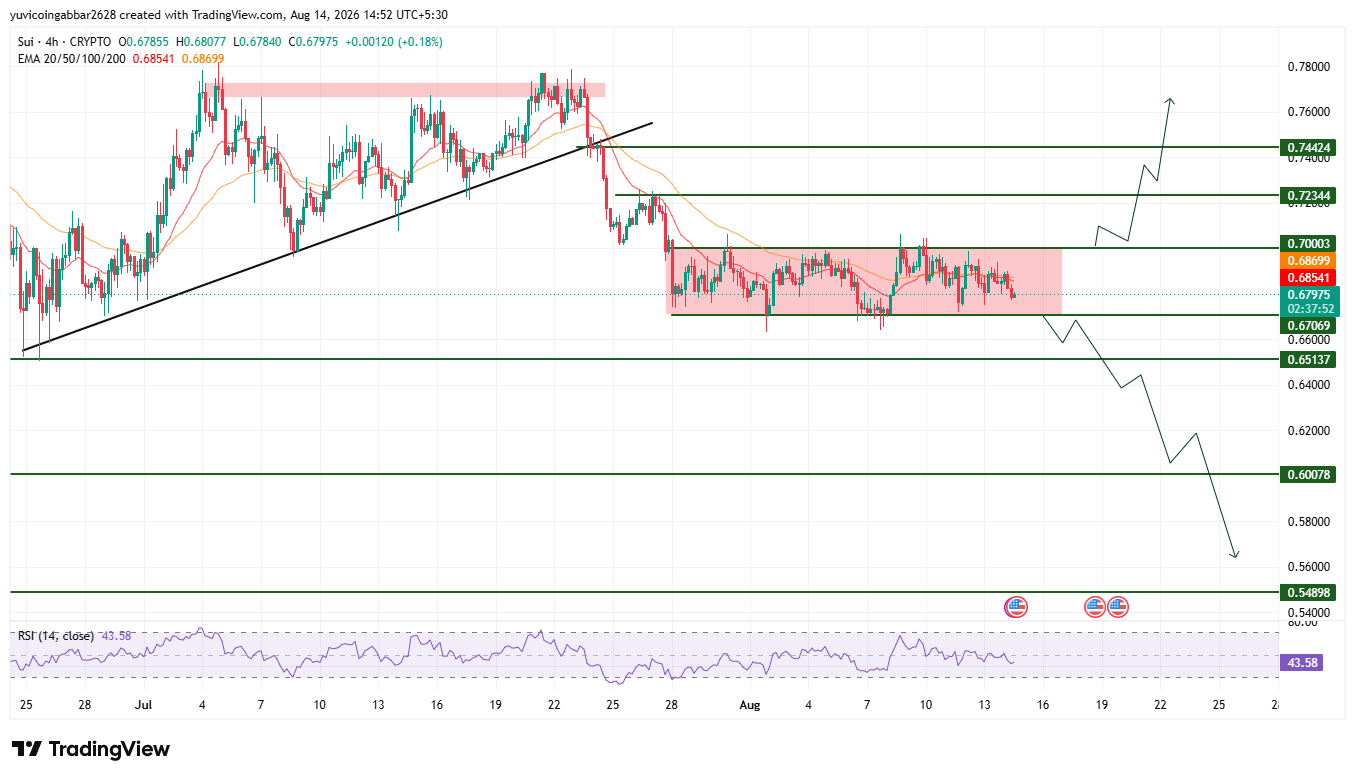
Support and Resistance Levels
Level Type | Price |
Resistance 3 | $0.74424 |
Resistance 2 | $0.72344 |
Resistance 1 (nearest) | $0.70003 |
Immediate Price Reference | $0.67975 |
First Support | $0.67069 |
Deeper Support | $0.65137 |
Additional Support | $0.60078 |
Structural Floor | $0.54898 |
EMA Levels
EMA | Price |
EMA 20 | $0.68541 |
EMA 50 | $0.68699 |
$SUI Price Prediction: Bull Case vs. Bear Case
$SUI price target 2026 Bull case: Holding above $0.67069 and clearing both EMAs near $0.68541 to $0.68699 would suggest the trendline breakdown is losing steam.
A confirmed close above $0.70003 would open the path toward $0.72344, and easing pressure on long positions would support that move.
$SUI price target 2026 Bear case: A break below $0.67069 would confirm sellers remain in control after the trendline breakdown.
Losing $0.65137 would expose $0.60078, with $0.54898 as the structural floor if the slide continues.
$SUI Price Scenarios: Triggers and Invalidation
Scenario | Trigger | Likely Outcome | Invalidation Point |
Trendline reclaim | Close above $0.70003 and above both EMAs | Move toward $0.72344, then $0.74424 | Rejection back below $0.70003 |
Channel hold | Price stays between $0.67069 and $0.70003 | Choppy, range-bound trading | Break of either boundary |
Channel breakdown | Close below $0.67069 | Move toward $0.65137, then $0.60078 and $0.54898 | Reclaim of $0.67069 |
$SUI price target: Can $SUI Reach $0.74424?
$0.74424 is the highest resistance level marked on the chart.
Reaching it would require SUI to first reclaim $0.67069 as a base, clear both EMAs near $0.68541 and $0.68699, then break and hold above $0.70003 and $0.72344 in turn, a multi-stage move rather than a single leg.
What Could Invalidate the Bullish Setup?
A rejection at the EMA zone or $0.70003 followed by a close back below $0.67069 would confirm the breakdown still has room to run.
A deeper break below $0.65137 and eventually $0.60078 would undermine the bullish case entirely, especially with long liquidations already elevated over the past 24 hours.
$SUI Price Prediction: Expert View
According to CoinGabbar analysts, the trendline breakdown remains the dominant story here, and the heavy skew toward long liquidations across every window shows leveraged buyers are still getting caught out.
RSI at 43.58 leaves room for a bounce without confirming one yet.
The $0.67069 to $0.70003 zone is the real battleground: holding it keeps a recovery case alive, while losing it opens the door to a deeper slide toward $0.65137 and below.
Disclaimer: This piece is for informational purposes only and isn't financial advice. The levels and scenarios above are based on technical chart analysis and publicly available data at the time of writing, and crypto markets can move sharply within hours, so past patterns don't guarantee future outcomes. It's worth doing independent research and considering your own risk tolerance before acting on any of the levels discussed here.
Also read:

















