Venice Price Prediction: Is This the Start of a Bigger VVV Move?


Venice Token (VVV) just picked up a headline-grade catalyst. A tweet from a well-known crypto figure confirmed the protocol crossed $100M in annualized revenue, and the token has responded with a fresh push higher off a support zone that has now been tested and held multiple times.
This Venice price prediction covers the revenue milestone, derivatives positioning, and the technical levels shaping VVV's next move.
What Is Happening With VVV Price?
VVV is trading at $13.39, up 10.13% over the last 24 hours. Market cap data shows the figure at $638.5M, up 10.14%, while 24-hour volume has jumped 300.09% to roughly $20.68M.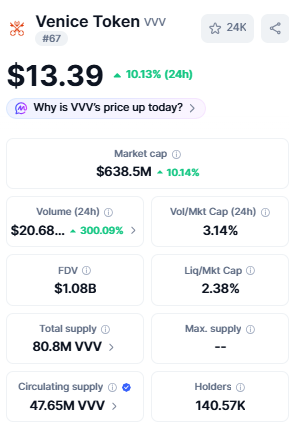
The token carries a $1.08B fully diluted valuation, with 47.65M VVV in circulation out of an 80.8M total supply and no fixed max supply and a holder base of 140.57K.
Revenue Milestone Behind the Move
The catalyst behind this move is real. Erik Voorhees posted that Venice just crossed $100M annualized revenue, a milestone that landed just as VVV was testing key support and helped fuel the token's latest push higher.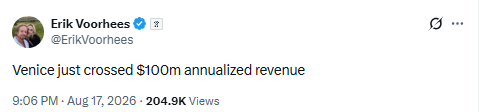
Revenue-based catalysts like this carry more weight than pure sentiment moves, since they point to underlying protocol usage rather than speculative flow alone.
What Are Futures Traders Signalling?
Futures volume is led by Binance at $25.56M, followed by Bybit ($8.70M), Hyperliquid ($6.87M), OKX ($4.15M), and Coinbase ($3.60M), with MEXC, Gate, BingX, LBank, Bitget, Bitunix, CoinEx, and Lighter rounding out the rest.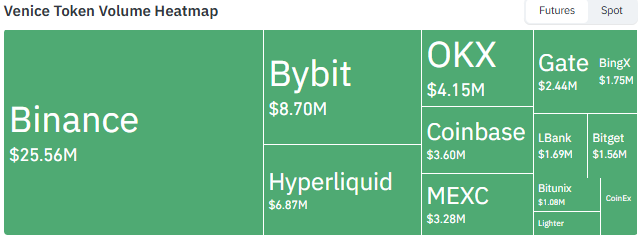
As per Coinglass data, open interest stands at $55.72M as of 18 August 2026, up from a recent low near $40M in early August, though still well off the $80M-plus levels seen back in mid-June.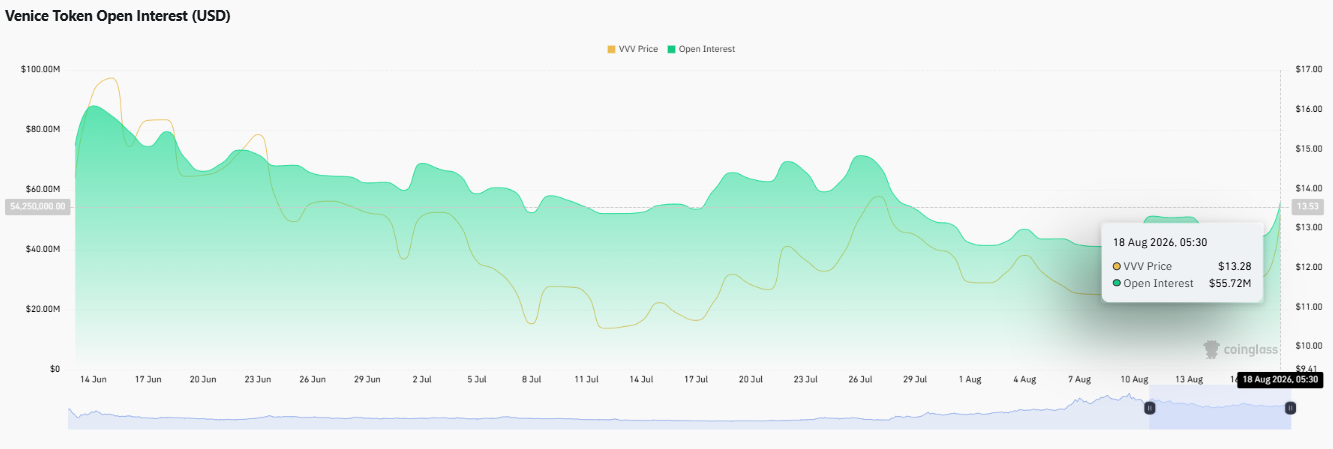
Positioning is heavily short-skewed across the board, a setup examined in earlier coverage of Venice's short squeeze sparks rally.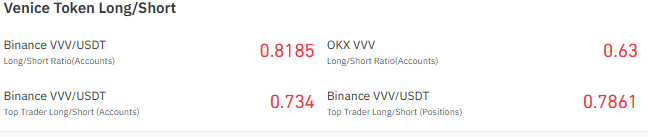
Binance's account-based long/short ratio sits at 0.8185, OKX runs lower still at 0.63, and Binance's top trader accounts show a 0.734 ratio, with the position-weighted long/short ratio for top traders at 0.7861.
With shorts this dominant, further upside could accelerate quickly if positions get squeezed.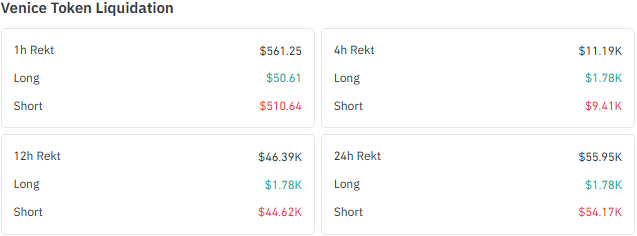
Liquidations back up that read. 24-hour liquidations total $55.95K, with $54.17K coming from short positions against just $1.78K in longs, showing shorts have already been paying the price as VVV pushed higher. The 1h and 4h windows show the same lopsided pattern.
Venice Technical Analysis: Support Holds, Fresh Upmove Builds
As per the TradingView chart, Venice traded inside a descending channel for weeks before breaking out on strong volume and touching resistance above.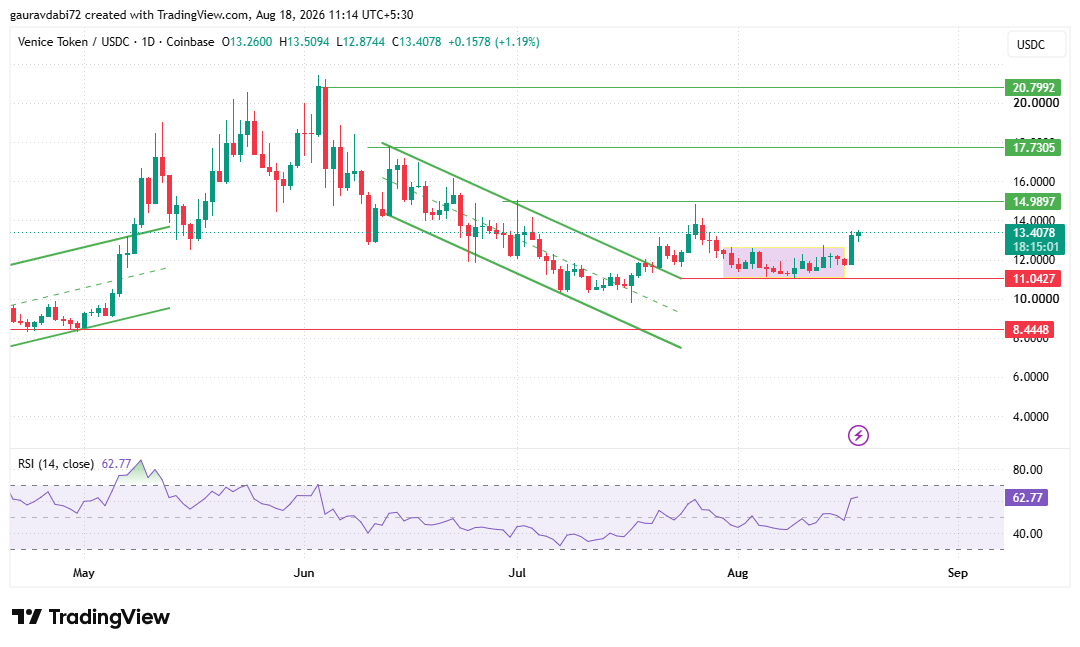
Price then came back down to retest the $11.0427 support, and rather than breaking down, VVV traded around that zone repeatedly, turning it into a well-established support level.
That kind of repeated test-and-hold behavior tends to strengthen a level rather than weaken it, since each successful defense absorbs more selling pressure.
From here, a fresh upmove is taking shape. The next resistance levels sit at $14.9897, $17.7305, and $20.7992, marking the zones where sellers could reappear as price advances.
None of these should be treated as guaranteed stops along the way, and each will need to be tested and cleared on its own.
Support now rests at $11.0427, the level that has already proven its strength, with $8.4448 as the deeper cushion further below if that zone eventually fails.
RSI reads 62.77, comfortably in bullish territory without yet reaching overbought extremes.
That leaves some room for the move to extend, though a chart with swings this large after such a steep decline calls for a degree of skepticism, a question explored directly in earlier coverage of whether VVV could crash to $5.
For now, the retested support and improving momentum favor the bulls, but confirmation through sustained buying above the recent highs would strengthen the case further.
Venice Price Prediction: Bull, Neutral and Bear Scenarios
Bullish Case | Continued buying above the retested $11.0427 support keeps $14.9897 as the first resistance in view, with $17.7305 and $20.7992 further out if momentum carries. |
Neutral Case | VVV consolidates between the $11.0427 support and $14.9897 resistance while the market digests the recent revenue-driven move. |
Bearish Case | A break below the $11.0427 support would put $8.4448 in focus as the next level to watch. |
How Has VVV Performed Recently?
VVV is up 2.15% over the past 4 hours and 10.22% over 24 hours, extending a 13.09% weekly gain.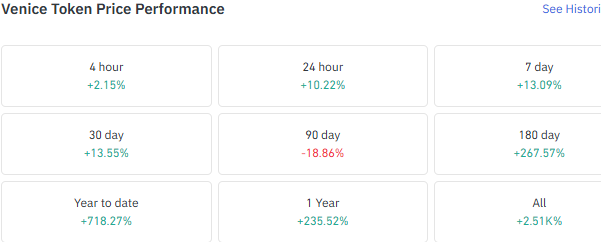
The 30-day figure is a more modest 13.55%, and the 90-day window is actually negative at -18.86%, showing how volatile this chart has been.
Zooming out, VVV is up 267.57% over six months, a striking 718.27% year to date, 235.52% over the past year, and 2.51K% since inception.
What We're Watching Next
As per the CoinGabbar analyst, the revenue milestone and the retested support give this move a stronger foundation than a purely technical bounce would carry on its own.
Broader coverage of VVV's future outlook and its Robinhood listing has tracked the token's path through several of these swings already, and how price behaves around the next resistance band will say more about the sustainability of this rally than the breakout candle itself.
Disclaimer: This article is for informational purposes only and should not be considered financial or investment advice. Cryptocurrency markets are highly volatile, and prices can move sharply in either direction. Readers should conduct their own research and consult a qualified financial advisor before making any investment decisions.







.webp)








