Superform Price Prediction (UP) 2026–2030: Targets & Analysis


Superform price prediction models are getting fresh attention this week after UP posted a sharp rally on the daily chart. As of the September 10, 2026 (15:25 UTC) snapshot, UP trades near $0.0871, up over fifty percent in 24 hours. This piece breaks down current price action, RSI and MACD readings, key support and resistance, and long-range Superform UP price prediction targets through 2030, built from the latest chart structure rather than guesswork.
Recent performance tells a story of neglect followed by sudden interest. UP spent June through August grinding sideways below $0.07. Then Superform's recent SuperSPCX announcement on tokenized stocks appears to have reignited trader attention.
This article forecasts near-term price action, yearly targets from 2026 to 2030, bull and bear scenarios, and tokenomics-driven dilution risk. None of it is financial advice. Crypto markets are volatile, and Superform's own price can move sharply in either direction within hours.
Superform Price Prediction at a Glance
Current UP Price
Metric | Value |
Price | $0.0871 (Sep 10, 2026, 15:25 UTC) |
24H Change | +51.08% |
7D Change | Roughly +70-80% off last week's $0.049 support zone |
Market Cap | $19.26M |
24H Volume | $27.47M |
Circulating Supply | 221.17M UP |
Max Supply | 1,000,000,000 UP |
ATH | $0.3226 (Jul 23, 2026) |
ATL | $0.02761 (Feb 18, 2026) |
Volume already exceeds market cap, per figures tracked on CoinMarketCap's UP listing. That's an aggressive turnover ratio.
It signals speculative trading, not slow accumulation.
Superform Price Prediction Today and This Week
UP Price Prediction Today
Momentum favors buyers today. The daily candle broke a descending trendline near $0.06-0.07 and extended straight into the $0.0857-$0.0871 zone on heavy volume.
A 50% single-day pop rarely holds without a pause.
UP Price Prediction Tomorrow
Expect either continuation toward the $0.10059 resistance zone or a pullback to retest the broken trendline, now acting as support near $0.07. Volume follow-through will decide which path plays out.
Watch whether trades stay above $0.075 into the next session.
UP Price Prediction This Week
Weekly bias leans bullish while price holds above the $0.04923 support zone. But RSI near 84 raises the odds of a cooling-off period before any fresh resistance test. BTC direction stays the wildcard, since altcoins like UP rarely decouple for long during broad market weakness. Traders comparing UP against similar setups can check a general crypto price prediction hub for context.
Superform Technical Analysis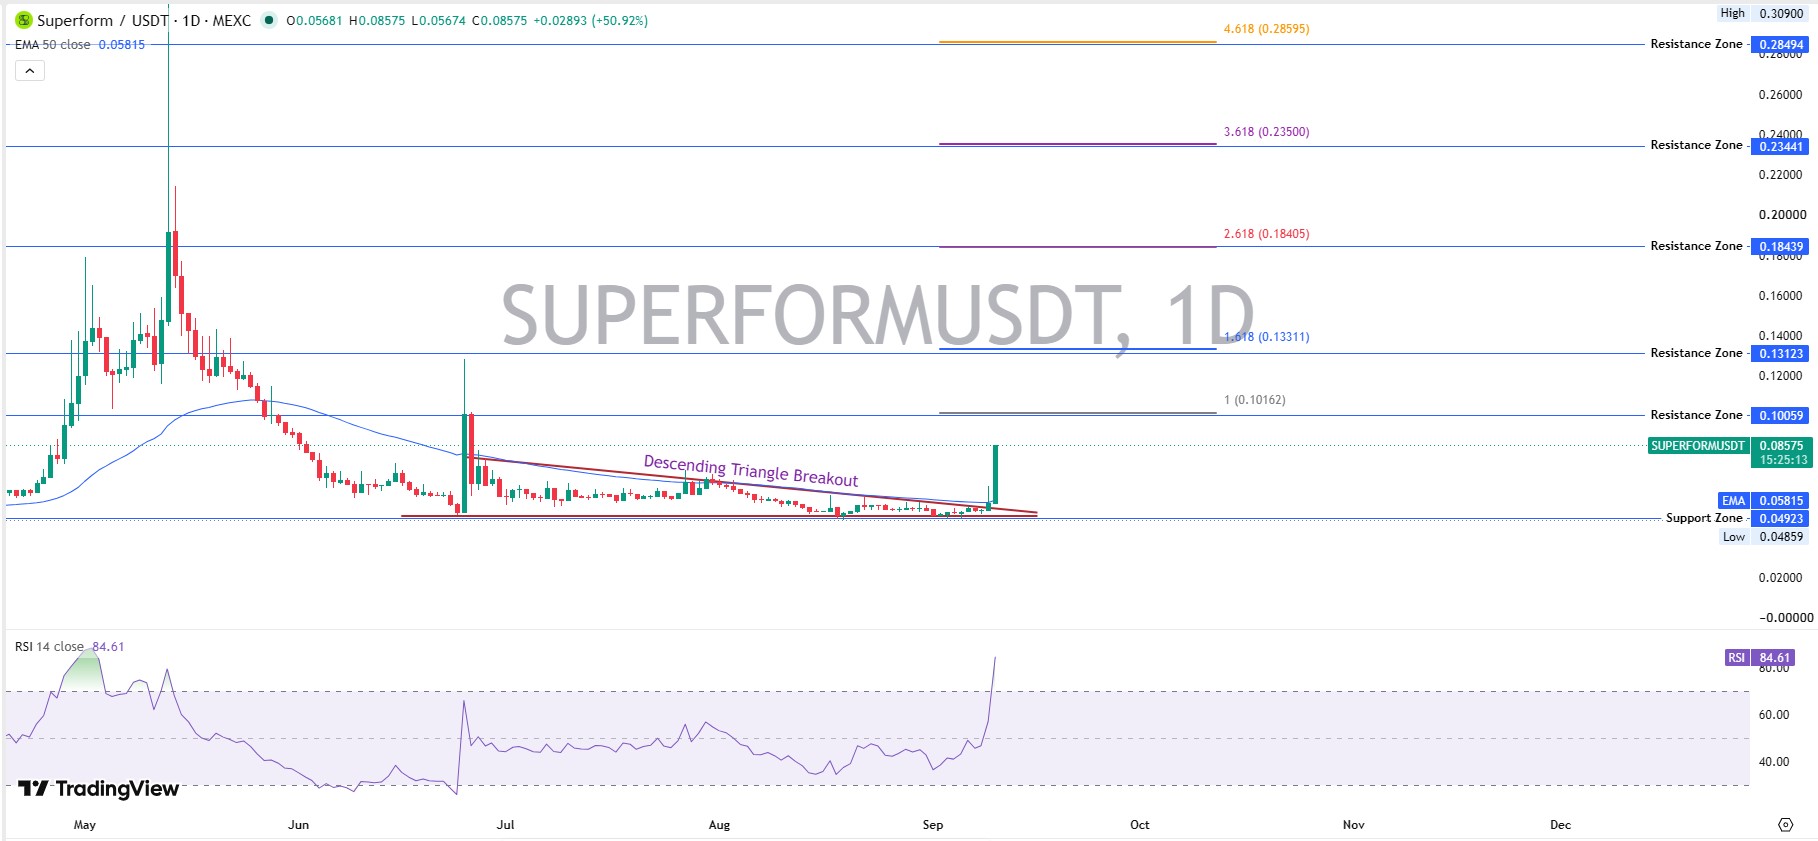
The current structure shows a breakout from a descending triangle on the daily chart, confirmed by a volume-backed green candle. RSI sits at 84.61, deep overbought. MACD flipped bullish, with the histogram expanding. Volume rose sharply alongside price, which supports the breakout rather than undermines it.
Current Trend
Bullish, short-term. The trendline break plus rising EMA-50 (now near $0.0582) both point upward.
RSI Analysis
RSI reads 84.61 on the daily chart. That's firmly overbought, above the typical 70 threshold traders watch.
No bearish divergence shows up yet.
But such an extreme reading often precedes a short cooldown, even inside an uptrend.
MACD Analysis
The MACD line sits at 0.00187, above the signal line at -0.00060. The histogram reads 0.00247 and is expanding. A bullish crossover already happened, and the widening histogram suggests momentum is building rather than fading. And that's a genuinely constructive signal for trades over the next few sessions.
Volume Analysis
Volume is rising alongside price, not fading into it. Twenty-four-hour volume near $27.47M against a $19.26M market cap is unusually high. This is especially important after a large move. Rising price plus rising volume generally confirms real demand rather than a thin, low-liquidity spike. Still, such volume ratios can reverse just as fast as they appeared.
Superform Support and Resistance Levels
Immediate Support
$0.07, the former descending trendline, now flipped to support after the breakout. Confirmation needs a bounce here on light selling. Invalidation comes with a daily close back below it.
Major Support
$0.04923, the multi-week base of the triangle pattern. This zone held for roughly two months. A confirmed daily close below it would invalidate the entire bullish structure.
Immediate Resistance
$0.10059, the first Fibonacci extension resistance zone. Confirmation requires a daily close above it with strong volume. Rejection here would likely send the price back toward $0.07.
Major Resistance
$0.13123, the 1.618 extension zone. A break above this level on volume would open the path toward $0.18439 next.
Breakout Confirmation
A daily close above $0.10059 with volume matching or exceeding recent levels would confirm the breakout is structural, not a one-day spike.
Superform Bull, Base and Bear Price Scenarios
Bull Case
A confirmed breakout above $0.10059 resistance, paired with sustained volume, a stable or rising BTC, and continued product catalysts (Earn on Stocks, SuperSPCX expansion), could push UP toward $0.13-$0.18 over the following weeks. A broader liquidity improvement across DEXs would help this case further.
Base Case
Most likely, UP consolidates between $0.07 and $0.10 while the market digests the breakout. Range-bound trading here would be healthy, not bearish.
Bear Case
A breakdown below $0.04923 support, paired with fading volume, BTC weakness, or fresh token unlocks, would likely send UP back toward $0.035-$0.045. Negative project news would accelerate that move.
Superform Price Prediction 2026
Scenario | 2026 Target | Conditions | Key Driver |
Bear | $0.045 | Support breakdown, volume fades | Whether $0.04923 support holds through Q4 |
Base | $0.09 | Range continuation near current levels | Steady trading between the breakout zone and $0.10059 resistance |
Bull | $0.18 | Resistance breakout, sustained volume | A confirmed close above $0.13123 with rising volume |
Base $0.09 implies a market cap near $23.4M, assuming circulating supply drifts to roughly 260M by year-end. Bear $0.045 reflects an $11.7M cap if the breakout fails, and support gives way. Bull $0.18 needs a $32.4M cap, achievable only if the current descending-triangle breakout keeps confirming on volume rather than fading into a single-day spike.
Superform Price Prediction 2027
Scenario | 2027 Target | Conditions | Key Driver |
Bear | $0.03 | Prolonged supply pressure, weak adoption | Whether team and investor unlocks outpace real demand |
Base | $0.15 | Gradual ecosystem growth, stable listings | Steady SuperVault deposits and modest holder growth |
Bull | $0.35 | New ATH, strong DeFi and tokenized-asset adoption | Broad tokenized real-world-asset demand meeting improved liquidity |
These ranges assume no major regulatory shock and a broadly neutral-to-positive crypto cycle. Precision beyond a range would be misleading this far out.
Base $0.15 implies a market cap near $60M, assuming circulating supply grows to roughly 400M as vesting continues. Bear $0.03 reflects a $12M cap if unlock-driven sell pressure overwhelms new demand, a real risk given how concentrated current holdings are. Bull $0.35 needs a $140M cap, which is plausible only if Superform's tokenized-stocks products pull in meaningfully more users than today's roughly 23,800 holders.
Superform Price Prediction 2028–2030
Year | Bear | Base | Bull | Key Driver |
2028 | $0.04 | $0.20 | $0.50 | Whether new exchange listings and wider Base ecosystem use offset ongoing dilution |
2029 | $0.05 | $0.28 | $0.70 | Broader Bitcoin cycle position, amplified either way by Superform's still-thin liquidity |
2030 | $0.06 | $0.35 | $0.90 | Whether UP becomes a genuinely distributed token rather than one dominated by a handful of large wallets |
Base-case figures assume steady circulating supply growth toward the 1B max, matched by proportional demand growth. Bull cases assume Superform becomes a leading tokenized real-world-asset platform. Bear cases assume dilution outpaces adoption.
Superform Price Prediction 2028: Base $0.20 implies a market cap near $110M, with circulating supply assumed around 550M. Bear $0.04 marks a $22M cap if liquidity stays thin and unlocks keep outweighing demand. Bull $0.50 needs a $275M cap, realistic only with wider Solana- and Base-chain adoption plus fresh listings.
Superform Price Prediction 2029: Base $0.28 equals a $196M cap, assuming supply near 700M under steady adoption. Bear $0.05 reflects a $35M cap if a weak Bitcoin cycle drags smaller altcoins down with it. Bull $0.70 needs a $490M cap and a real tradable float, not just a strong chart.
Superform Price Prediction 2030: Base $0.35 implies a $297.5M cap, built on gradual holder growth from current levels. Bear $0.06 marks a $51M cap if whale concentration, currently near 87.99% among top wallets, never meaningfully eases. Bull $0.90 needs a $765M cap, plausible only if Superform's holder base expands well beyond today's roughly 23,800 addresses.
What Could Drive Superform Price Higher?
Superform Ecosystem Growth
Expansion of SuperVaults and cross-chain yield products would draw fresh deposits. Fresh airdrop announcements tied to ecosystem campaigns often bring in new wallets too.
Liquidity and Exchange Listings
More exchange pairs generally reduce slippage and attract larger holders. Fresh new exchange listings tend to coincide with volume spikes like the one seen this week.
Product Development
The tokenized-stocks push, including SuperSPCX and NVDA vaults, is already driving fresh headlines.
Partnerships
Coinbase-linked tokenized stock integrations and Base ecosystem ties add credibility.
DeFi Adoption
Rising demand for yield-bearing tokenized assets could pull new users toward Superform, a trend that overlaps with recent AI token developments drawing similar capital.
Broader Crypto Market
A risk-on altcoin cycle tends to lift small-cap tokens like UP disproportionately, the same way memecoin market updates often show during broad rallies.
Bitcoin Correlation
UP still trades in loose correlation with BTC. Sustained BTC strength usually helps.
What Could Push UP Lower?
Token Supply Pressure
With only about 22% of max supply circulating, future unlocks are a real overhang.
Unlocks and Emissions
Vesting schedules for team and investor allocations could add sell pressure over time. Checking a crypto events calendar ahead of unlock dates can help traders anticipate this.
Liquidity Risk
Whale concentration is high. Top holders control a large share of circulating tokens.
Market-Wide Selloff
A broad crypto downturn would drag UP down regardless of project fundamentals.
Project Execution Risk
Delays in the tokenized-stocks roadmap could cool current enthusiasm quickly.
Regulatory/Security Risks
Tokenized equities sit in a legally sensitive zone. Regulatory action anywhere could hit sentiment hard.
Superform Tokenomics and Supply Risk
Circulating supply sits near 221.17M UP against a 1B max supply. That's roughly 22% of total tokens in circulation.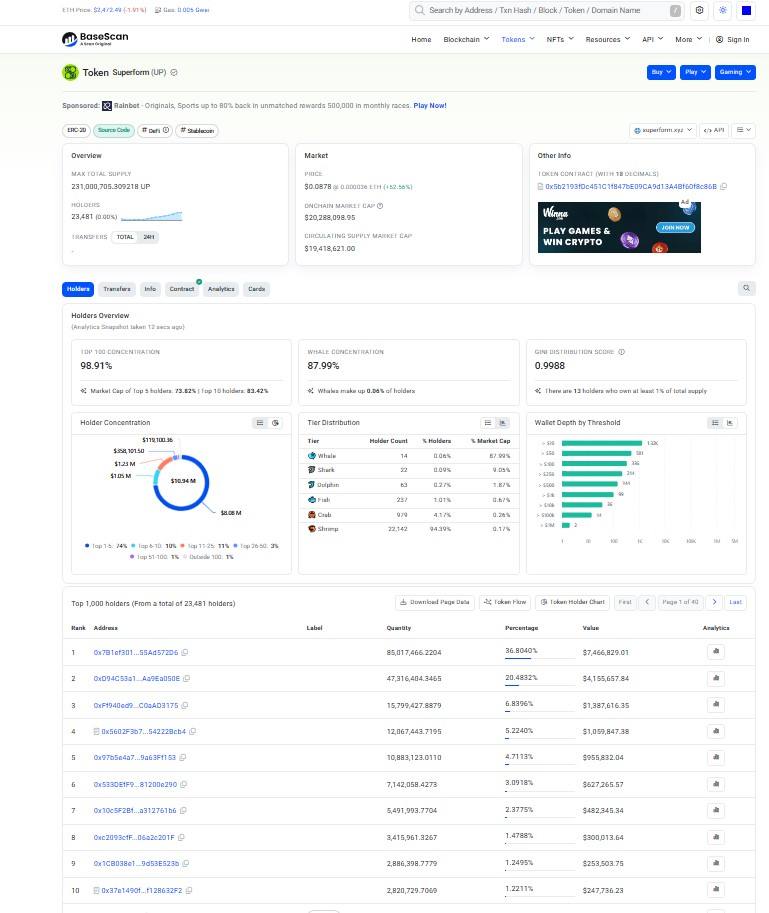
Nearly 78% remains locked, vesting, or unissued. BaseScan's holder analytics also show heavy whale concentration among top wallets, a factor worth watching alongside supply unlocks.
That's a meaningful dilution risk for any long-range Superform UP price prediction. As team, investor, and ecosystem allocations unlock, sell pressure could offset price gains even if usage grows. Traders watching a multi-year forecast should track the project's public unlock schedule closely, since emissions timing can matter more than demand in the short run. Turns out, supply math often decides long-term price more than any single catalyst.
Can Superform Reach $0.10?
At $0.10, required market cap equals price times circulating supply: $0.10 × 221.17M = roughly $22.1M. The current market cap already sits near $19.26M, so this target is close to current levels and realistically achievable on continued momentum.
Fully diluted valuation (FDV) at $0.10 would be $0.10 × 1B = $100M. That's a modest FDV by mid-cap altcoin standards, which makes $0.10 a near-term, plausible level rather than a stretch.
Can Superform Reach $1?
At $1, required market cap equals $1 × 221.17M = roughly $221M, over ten times current levels. FDV at $1 would be $1 × 1B = $1B.
A billion-dollar FDV would require Superform to become a genuinely major player in tokenized real-world assets, with deep liquidity and broad adoption well beyond current holder counts. It's not impossible over a multi-year horizon. But it demands a lot more than the current chart alone can justify.
Superform Price Prediction Invalidation Levels
Bullish thesis invalidation: A confirmed daily close below $0.04923 would break the entire triangle-breakout structure.
Bearish thesis invalidation: A confirmed daily close above $0.10059 with strong volume would confirm the breakout and open room toward $0.13123 next.
Superform Trader Takeaway
Trend: Bullish (short-term) Momentum: Strong, but overheated (RSI 84.61) Resistance: $0.10059 Support: $0.04923 Bull trigger: Daily close above $0.10059 on volume Bear trigger: Daily close below $0.04923 Invalidation: Either level above, confirmed with volume What to watch next: BTC direction, follow-through volume, and any fresh token-unlock news
Disclaimer
This article is for informational purposes only and does not constitute financial, investment, or trading advice. Cryptocurrency prices, including Superform (UP), are highly volatile and can move sharply in either direction. Price predictions are speculative estimates based on chart patterns and available data at the time of writing, not guarantees of future performance. Anyone considering exposure to UP should conduct independent research and consult a qualified financial advisor before making decisions.

















