Shiba Inu Price Prediction: Why This Setup Could Define SHIB's Month

The Shiba Inu coin is heading into a stretch that could shape its direction for the rest of the month, and that's the focus of this Shiba Inu Price Prediction.
Shiba Inu launched in 2020 as a decentralized meme token and has since grown into one of the more widely held assets in the market, currently sitting at #34 by market cap.
The Shiba Inu price today is trading at $0.00000517, down 5.6% as part of today's move. Market cap stands at $3.055B, with $79.217M over the past 24 hours.
Live Market Data
| Metric | Value |
| Price | $0.00000517 |
| Market Cap | $3.055B |
| Fully Diluted Valuation | $3.056B |
| 24-Hour Trading Vol | $79.217M |
| Circulating Supply | 589.239T |
| Total Supply | 589.496T |
Source: Shiba Inu market data taken from CoinGecko, as of Sep 10, 2026. Figures may vary slightly across other tracking websites.
Shiba Inu Exchange Volume
LBank sits at the top of Shiba Inu coin's futures activity with $16.20M in 24-hour volume.
OKX follows at $13.85M, MEXC comes next at $6.26M, and Bitget adds $5.39M.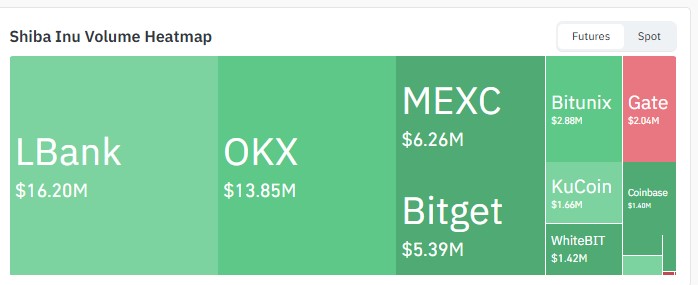
Source: Volume Heatmap Data Taken From CoinGlass , As of Sept 10, 2026.
What's left trickles through Bitunix, Gate, KuCoin, WhiteBIT, and Coinbase in smaller amounts.
Shiba Inu News Today: Burn Activity Cools
Burn Rate Slows From the Prior Period
Shibburn reported that $4,132,000 in SHIB was burned over the past 24 hours, worth around $22.16 at current prices.
That said, the daily burn rate itself dropped 49.53% from the period before, so burning still happened, just at a noticeably slower pace. 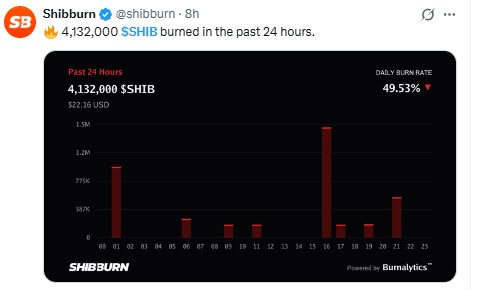
Source: Data Taken From @shibburn , X Account, as of Sep 10, 2026
This kind of shiba inu coin news rarely moves price on its own, but it's the sort of supply-side detail some traders keep an eye on regardless.
Shiba Inu Price Prediction 2026: Technical Outlook
Pull up the daily SHIB/USDT chart on Binance, and the price has been squeezing into a symmetrical triangle since late August, a descending trendline pressing down from above while a rising trendline pushes up from below. $SHIB is now sitting right near the apex of that structure. 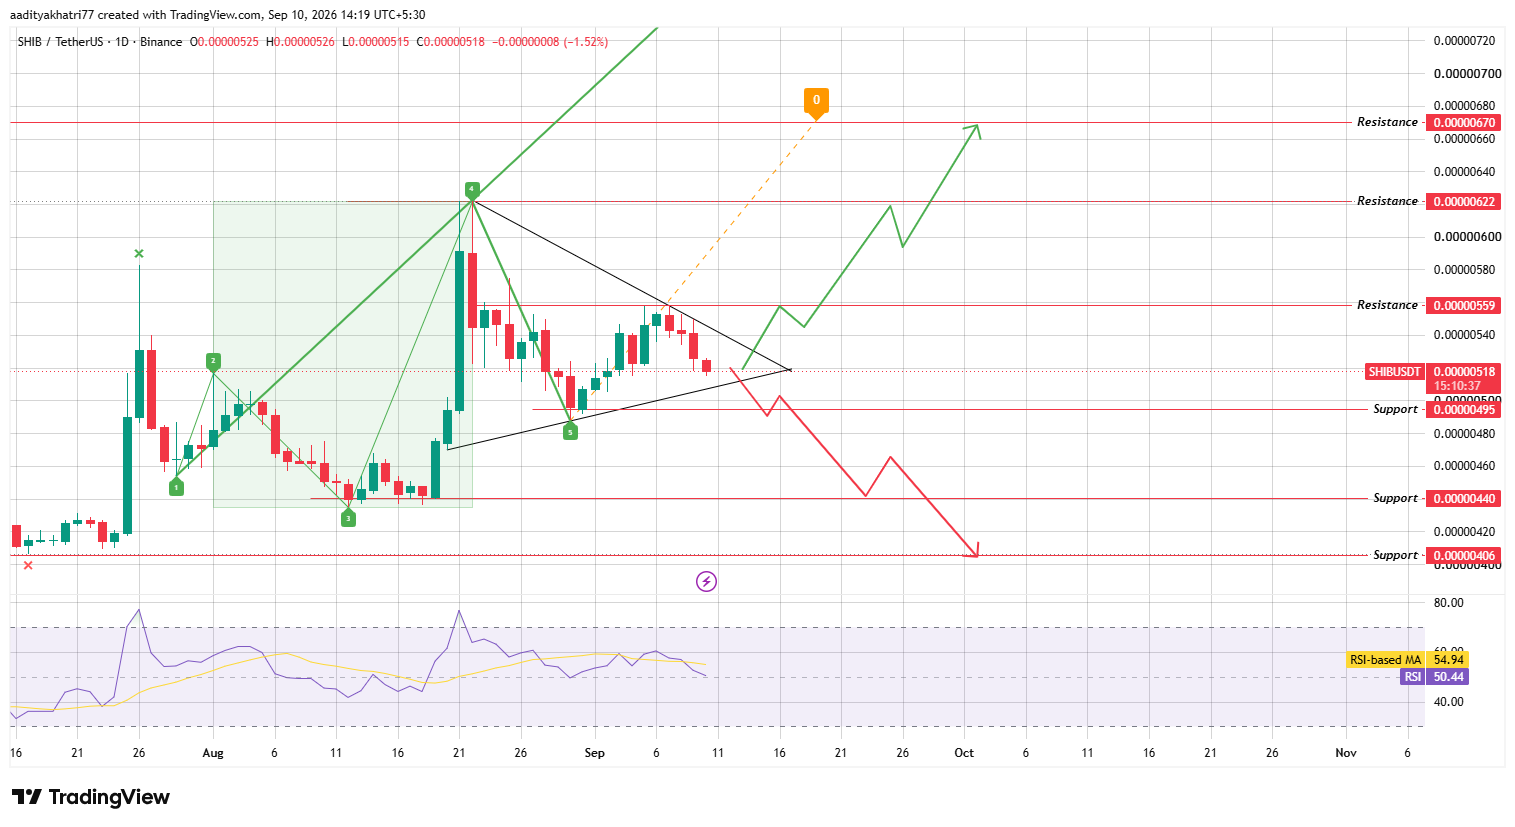
Source: Chart Taken From TradingView , as of Sep 10, 2026
RSI reads 50.44, just under its moving average of 54.94, close enough to neutral that it doesn't lean strongly either way.
There's also a wolfe wave pattern on the chart, and it projects an upside target near $0.0000067, which keeps the setup leaning constructive if the triangle breaks higher.
Could SHIB Break Toward Higher Resistance?
Clear the triangle's descending trendline on a daily close with volume behind it, and $0.00000559 becomes the first stop.
Push past that too, and $0.00000622 opens up, with $0.0000067 next in line if buying pressure keeps carrying.
What Happens If SHIB Breaks the Rising Trendline?
Flip it around. A break below the rising trendline, confirmed by volume, points first to $0.00000495.
Slip past that and $0.00000440 comes into view, with $0.00000406 as the next level if the decline keeps going.
Support and Resistance Levels
| Support | Resistance |
| $0.00000495 | $0.00000559 |
| $0.00000440 | $0.00000622 |
| $0.00000406 | $0.0000067 |
Bull, Base, and Bear Scenarios
| Scenario | Setup | Level |
| Bull | Break above the descending trendline on volume. | $0.00000559–$0.0000067 |
| Base | Price consolidates near the triangle apex. | $0.00000500–$0.00000550 |
| Bear | Break below the rising trendline on volume. | $0.00000495–$0.00000406 |
SHIB vs XRP
$SHIB and $XRP are sitting at fairly different points right now.
The XRP price today reflects a token consolidating inside a bullish flag after a strong rally, with fresh ETF inflow data backing that setup, while SHIB is still working through a tighter, more indecisive triangle with no comparable near-term catalyst behind it.
Any xrp price prediction built on its current chart leans on institutional flow data that $SHIB simply doesn't have a parallel for at the moment, which goes a long way toward explaining why the two tokens carry such a different tone this week, despite both being long-established names in the broader altcoin market.
Expert Opinion
Traders following the $SHIB coin's setup point out that a symmetrical triangle this close to its apex usually doesn't sit still for long; the range simply gets too narrow to hold indecision much further.
Most treat the cooling burn rate as a footnote against the bigger technical picture, and the general sense is that the actual breakout direction will hinge more on broader market conditions than on any single piece of shiba inu news this week.
Disclaimer: This Shiba Inu price prediction is for informational purposes only and should not be treated as financial advice. Cryptocurrency markets are highly volatile, technical patterns can fail to play out as expected, and any of the scenarios described above carry a realistic probability of not occurring. Readers should conduct independent research before making any investment decisions.

















