Algorand Price Prediction: $ALGO Breakout or Bull Trap?


Algorand is quietly coiling for a move $ALGO's 24-hour volume just jumped over 4% even as price ticks lower, a sign traders are positioning before the next breakout.
The token has been squeezing into a tighter and tighter range for weeks, and squeezes like this in crypto tend to end with a sharp move one way or the other.
Is this Algorand price prediction setup about to break wide open?
Market data was checked on September 10, 2026, at 15:26 IST.
Algorand Price Prediction Today: Market Overview
Metric | Value |
Price | $0.097509 |
24h Change | -1.45% |
Market Cap | $879.8M (-0.97%) |
FDV | $973.92M |
24h Volume | $35.71M (+4.64%) |
Vol/Mkt Cap (24h) | 4.05% |
Total Supply | 10B ALGO |
Max Supply | 10B ALGO |
Circulating Supply | 9.03B ALGO |
Source: Data from CoinMarketCap as of September 10, 2026, at 15:26 IST. Figures may vary slightly across other tracking websites.
Algorand Price Prediction Chart: Technical Analysis
Pair: ALGO/USD · Market: Spot (Crypto) · Exchange: TradingView · Timeframe: 1D · Timestamp: September 10, 2026, 15:26 IST
$ALGO Price Trading and opened at $0.098939, ran to a high of $0.101022, dipped to $0.096931, and closed at $0.097509, down 1.45% on the day.
Price has been squeezing into a narrowing wedge since late August. The recent pullback is happening right after a test of the $0.104818 resistance zone.
The key point is to identify which direction the breakdown occurs.
Once the price breaks the Rising wedge pattern, we can better determine the next potential move.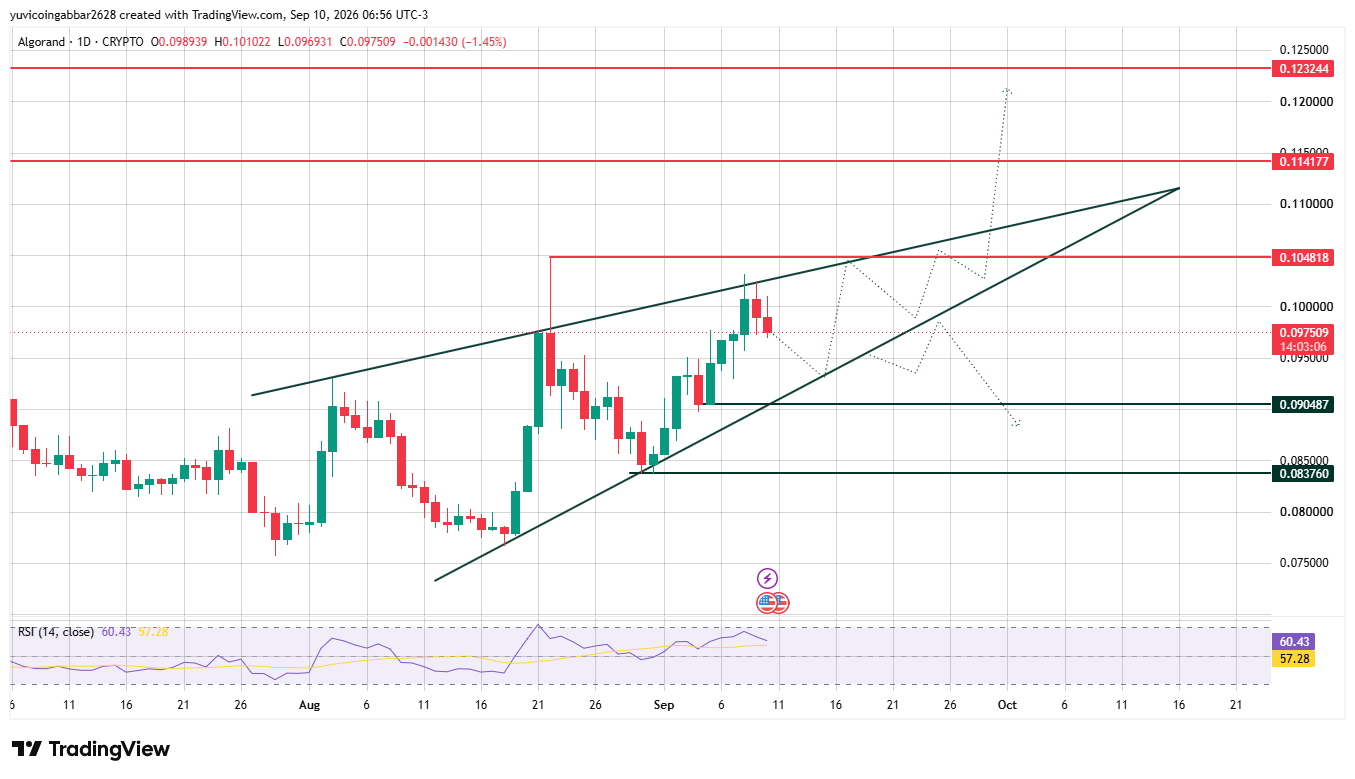
Crypto News Today: Key Levels
Level Type | Price |
Resistance 3 | $0.123244 |
Resistance 2 | $0.114177 |
Resistance 1 (nearest) | $0.104818 |
Immediate Price Reference | $0.097509 |
First Confirmed Support | $0.090487 |
Deeper Support | $0.083760 |
Algorand Forecast: Bull Case vs Bear Case
Bull case: Holding above $0.090487 and clearing the nearest resistance at $0.104818 would confirm the wedge is resolving to the upside, opening room toward $0.114177 and eventually $0.123244.
Bear case: A break below $0.090487 would put the wedge structure at risk of resolving lower instead. Losing $0.083760 would expose ALGO to a deeper pullback toward the range lows seen in late August.
Algorand Price Scenarios: Triggers and Invalidation
Scenario | Trigger | Likely Outcome | Invalidation Point |
Breakout | Close above $0.104818 | Move toward $0.114177 | Close back below $0.090487 |
Consolidation | Range between $0.090487 and $0.104818 | Continued wedge squeeze | Break of either boundary |
Breakdown | Close below $0.090487 | Slide toward $0.083760 | Reclaim of $0.090487 |
Can ALGO Reach $0.123244?
$0.123244 is the highest resistance level marked on the chart.
Getting there would require ALGO to clear $0.104818, then $0.114177, in stages, with each level needing to flip from resistance to support along the way.
Algorand Price Prediction: Bitcoin's Role in the Bigger Picture
Broader market direction still matters here.
Most Bitcoin price prediction outlooks for the current cycle see Bitcoin holding its range as a key condition for mid-cap coins like ALGO to break out of tightening patterns like this one, since a sharp Bitcoin drop tends to compress volatility out of smaller names rather than let them resolve upward.
Algorand Price Prediction 2026: Expert View
According to CoinGabbar analysts, ALGO's narrowing wedge and the pickup in volume despite a lower close suggest a decision point is close.
The $0.090487 to $0.104818 range is the zone to watch this week for which way the squeeze resolves.
Algorand Price Prediction: Data Sources
Price and support/resistance data referenced from a 1D ALGO/USD chart via TradingView, timestamped September 10, 2026, 15:26 IST. Market cap, FDV, volume, and supply data referenced from a crypto market tracker.
Disclaimer: This piece is for informational purposes only and isn't financial advice. The levels and scenarios above are based on technical chart analysis and publicly available data at the time of writing, and crypto markets can move sharply within hours, so past patterns don't guarantee future outcomes. It's worth doing independent research and considering your own risk tolerance before acting on any of the levels discussed here.

















