Theoriq Price Prediction: THQ Breaks Out, But Can It Hold


A chart that had gone nowhere for weeks just moved 67% in a day. That alone gets people typing "Theoriq price prediction" into search bars at midnight. No listing headline, no partnership drop. So what flipped the switch?
Turns out, the answer sits in the candles, in who holds the supply, and in a calendar event most traders haven't clocked yet. For context on how other tokens are trending right now, our crypto price prediction hub tracks similar setups across the market.
Key Takeaways
-
THQ trades near $0.0173 (snapshot: July 27, 2026, 02:41 UTC), up roughly 67% in 24 hours, according to live pricing data on CoinMarketCap.
-
The 4-hour chart broke out of a falling wedge; RSI there reads 85.26, deeply overbought.
-
Weekly RSI sits at just 36.47, still below neutral, an unusual gap against such a strong daily move.
-
Weekly resistance sits at $0.01964 (being tested now), then $0.02731 and $0.03484.
-
Support sits at $0.01005, then $0.00604.
-
Circulating supply is only 154.22M THQ against a 1 billion max supply, about 15% unlocked, a bigger overhang than most tokens carry at this stage.
-
Top 100 wallets hold 99.9% of tracked supply, and 21 whale wallets (2.56% of holders) control 90.72% of market cap.
-
None of the top ten wallets carry a public label.
Token Contract
Address: 0xaffbe9a60f1f45e057fd9b6dc70004bb0ccc8b99
Standard: ERC-20 (also on Base)
Security Rating: CertiK 3.9/5
Anyone who wants to verify holder distribution directly can check the mainnet contract on Etherscan rather than rely on aggregated figures alone.
Where THQ Stands Right Now
THQ last traded around $0.0172–$0.0173, up about 67% over 24 hours, with an intraday range of $0.01025 to $0.01933. This move arrived fast, not gradually.
The circulating supply is 154.22M of a 1B max, leaving about 85% of the supply outside circulation, well above what mature DeFi tokens usually carry at this stage. The all-time high, $0.18, was set on December 16, 2025, at mainnet launch. The current price sits roughly 90% below that peak. The all-time low, $0.01011, was set just three days before this snapshot. Traders comparing this dilution profile against a blue-chip benchmark can see how it stacks up in our Ethereum price prediction coverage.
Holder counts diverge by source: CoinMarketCap lists about 10.23K holders; Etherscan's mainnet contract shows 819. That's because THQ also lives on Base; CoinMarketCap aggregates across chains, while Etherscan counts the Ethereum mainnet only.
What's Driving the Move
There's no single press release behind this. What we do have is a token that woke up on volume more than five times its own market cap.
Worth flagging: Theoriq's CEO announced on X on July 24 that the company is joining an institutional panel at the Stanford Blockchain Application Summit on July 30, alongside names like Anchorage and Kraken. Not a confirmed catalyst, but the timing, three days before the breakout, lines up. Layer that onto crypto's broader AI token narrative, and thin liquidity meeting a mood shift looks like the simplest explanation.
Technical Analysis: 4-Hour Chart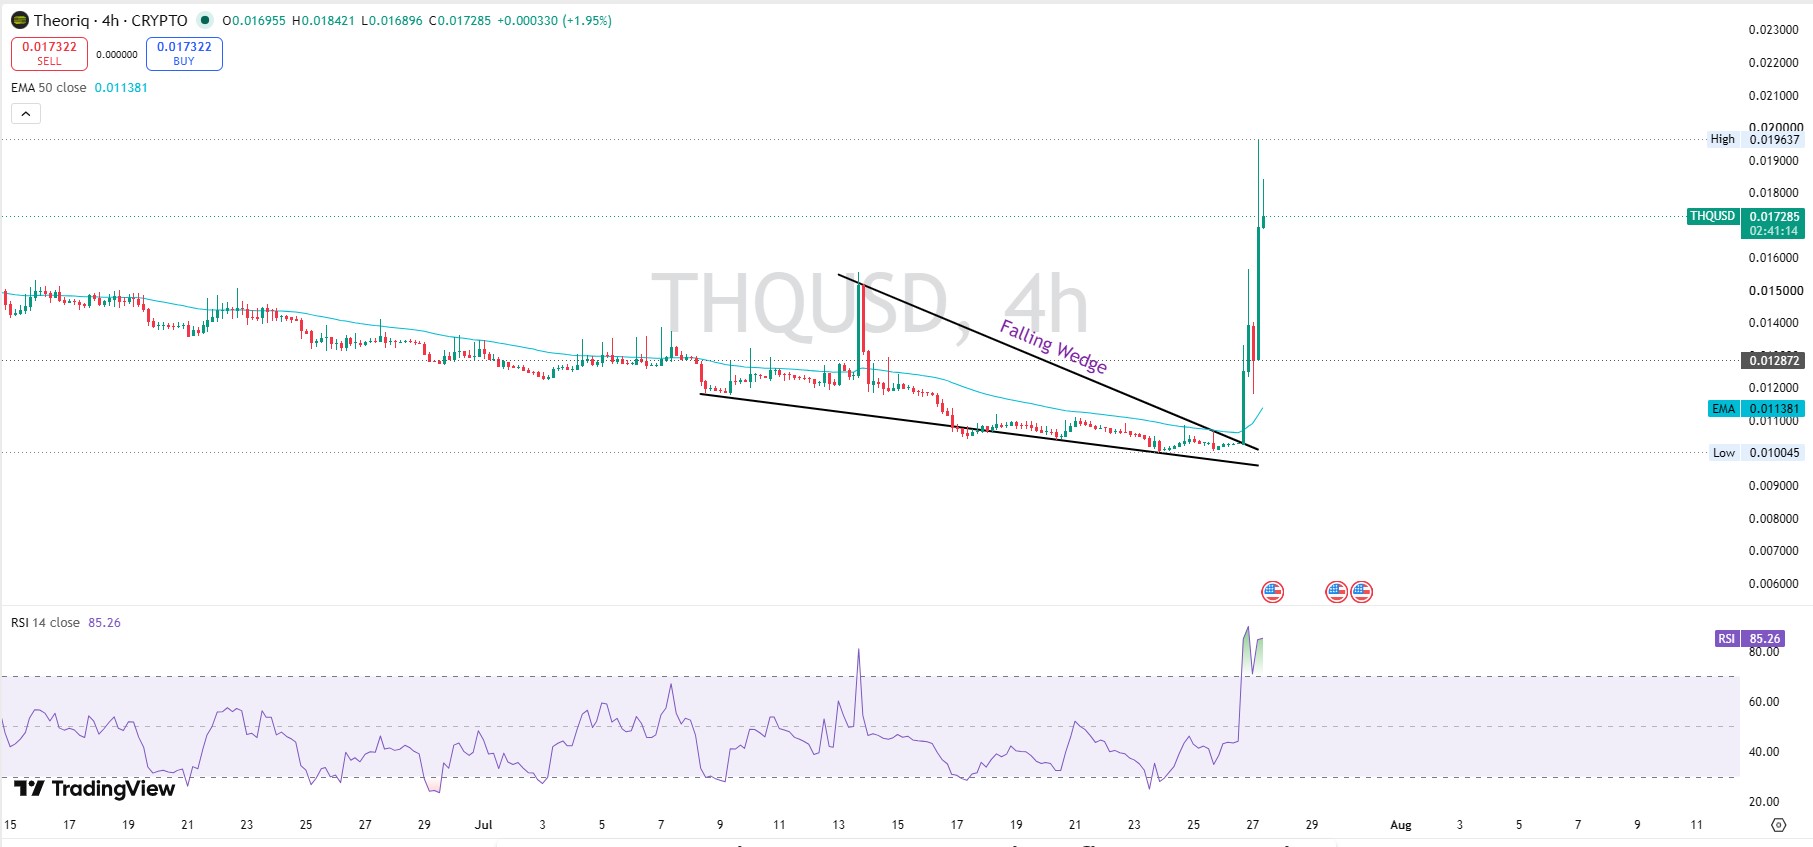
Price spent weeks compressing inside a falling wedge before one candle broke it open, running from roughly $0.011 to a high of $0.01964 before settling near $0.0173. RSI reads 85.26, stretched. The 50-EMA sits at $0.01138, far below price, confirming a sharp short-term trend flip.
| Level | Price |
|---|---|
| Resistance 1 | $0.01964 |
| Current | $0.0173 |
| Support 1 (EMA) | $0.01138 |
| Support 2 | $0.01005 |
Technical Analysis: Weekly Chart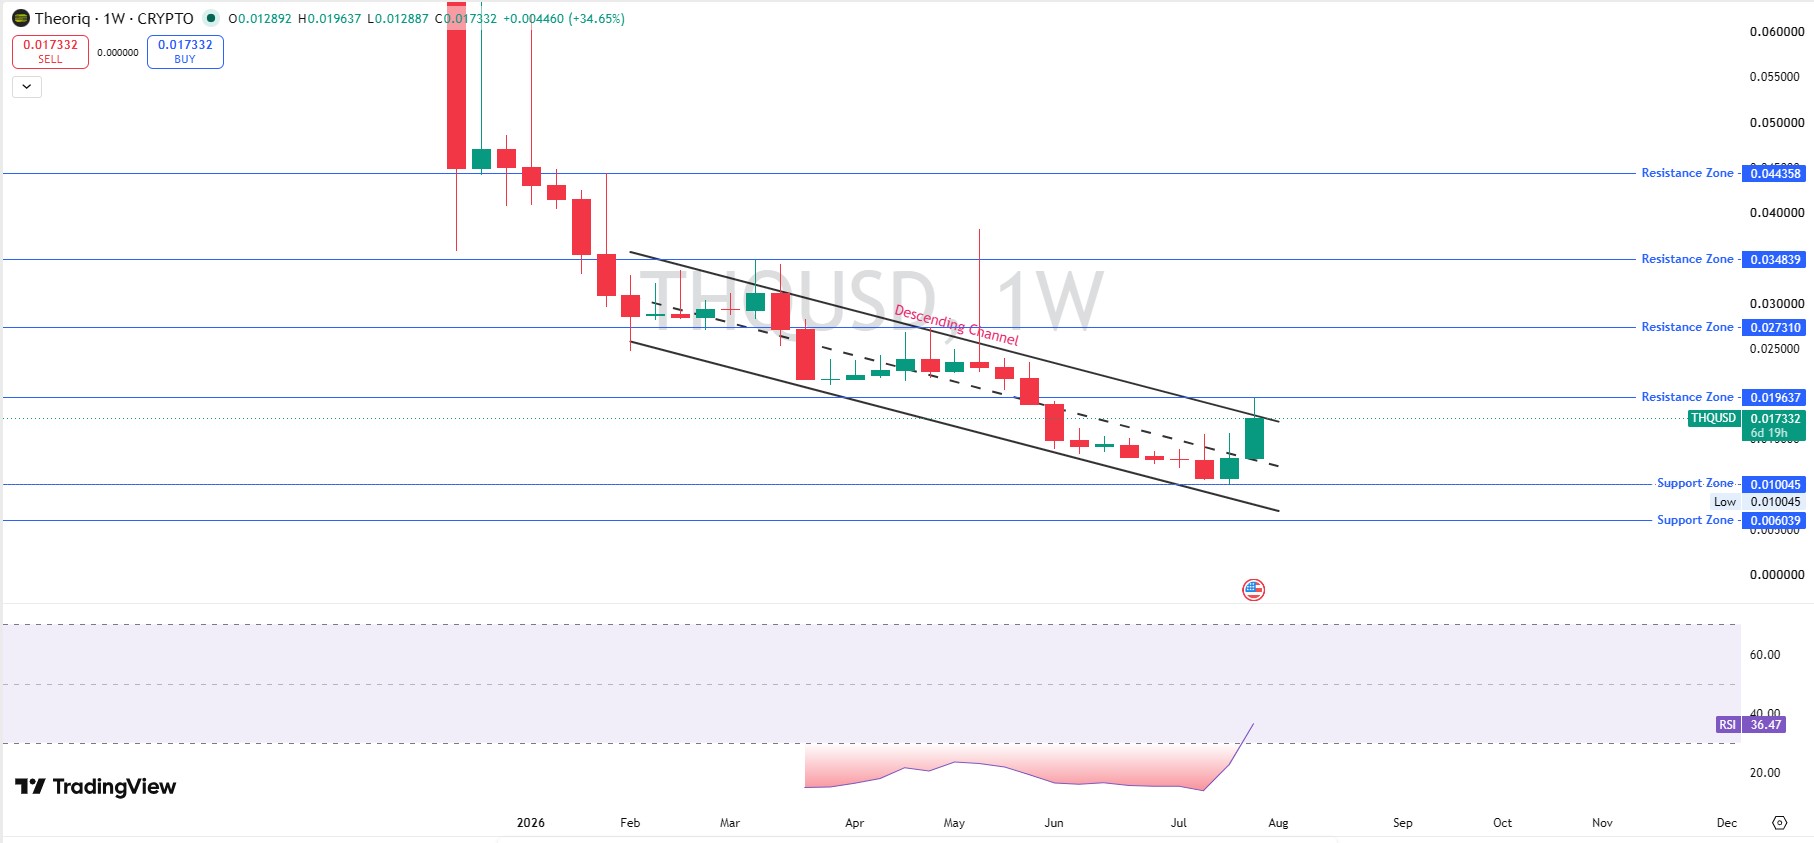
The weekly candle opened near $0.01289 and closed around $0.01733, up about 34.65%, inside a descending channel that's held since January 2026. Weekly RSI reads 36.47, still under 50. That's the real tension here: a week this strong hasn't even pushed momentum back to neutral. Readers tracking how the broader market's largest asset is behaving, we can cross-check it against our Bitcoin price prediction for a macro read.
| Level | Price |
|---|---|
| Resistance 3 | $0.04436 |
| Resistance 2 | $0.03484 |
| Resistance 1 | $0.01964 |
| Current | $0.01733 |
| Support 1 | $0.01005 |
| Support 2 | $0.00604 |
Liquidity and Volume
A spot volume snapshot shows Gate leading at $706.83K, Coinbase close behind at $661.71K, a fairly even split rather than one venue dominating. Liquidity relative to market cap sits at 29.62%, and 24-hour volume near $15.71M against a $2.65M market cap is a vol-to-cap ratio above 500%, a thin float meeting outsized demand. Anyone weighing whether more venues could pick up THQ should keep an eye on our exchange listing tracker.
Tokenomics and Holder Concentration
THQ has a fixed 1 billion supply and positions itself as the coordination token for an "agentic economy": stake THQ into sTHQ, lock it into non-transferable αTHQ for 1 to 24 months, and then delegate to AI agents for fee discounts. The full mechanics are laid out in Theoriq's own litepaper.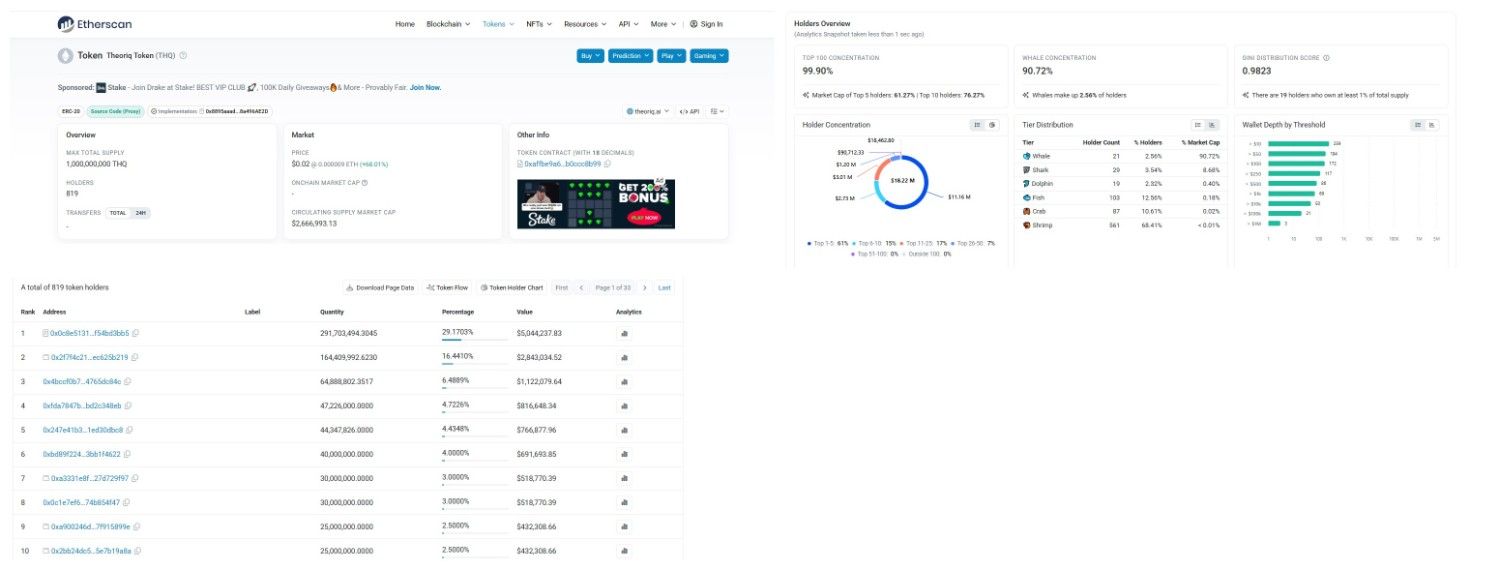
Concentration is the uncomfortable part. Top 100 wallets hold 99.9% of supply; the Gini score is 0.9823, near maximum inequality. The top 10 wallets alone hold about 76%, and none carry a public label on Etherscan, so there's no way to confirm whether they're team wallets, exchange custody, or independent whales. It's a similar red flag to what we found when we ran the CertiK security audit check on another AI agent token earlier this year.
Bull, Base, Bear Scenarios
Not financial advice, just scenarios built from the chart.
Bull (30%): Daily close above $0.01964 opens a path to $0.02731 within 7–14 days. Invalidation: close back below $0.0150.
Base (45%): Range between $0.014 and $0.0196 for 7–30 days. Invalidation: weekly close outside that range.
Bear (25%): Retrace to the $0.01138 EMA, possibly $0.01005, within 30 days. Invalidation: price holding above $0.017 for over a week. Similar tiered scenarios played out during the Pepeto presale review, where a thin float created comparable swings.
Price Forecast Table
| Timeframe | Bear | Base | Bull |
|---|---|---|---|
| 24H | $0.0155 | $0.0175 | $0.0192 |
| 7D | $0.0120 | $0.0165 | $0.0210 |
| 30D | $0.0090 | $0.0150 | $0.0270 |
| Long Term | $0.0060 | $0.0200 | $0.0450 |
Key Risks
4-hour RSI near 85 leaves little room before a cooldown. About 85% of supply remains outside circulation, a real dilution risk. Holder concentration is severe and largely unlabeled. Price still sits roughly 90% below its all-time high, and broader crypto sentiment can override any single token's setup. For a deeper look at how staking lockups can compound this kind of risk, see our staking sustainability review.
Glossary
RSI: a 0–100 momentum indicator; above 70 is overbought, below 30 is oversold. EMA: Trend average weighting recent prices more heavily.
FDV: Market cap if all tokens were circulating.
Gini Score: Distribution inequality, 0 to 1.
Falling Wedge: Converging chart pattern that often breaks upward. Newer traders can find plainer breakdowns of these terms across our crypto news coverage.
Traders wanting to flag the July 30 Stanford panel and any follow-on unlock dates can add THQ to our events calendar for real-time reminders. Those exploring newer AI-agent tokens with early distribution can also browse current crypto airdrops.
Disclaimer: For informational purposes only, not financial advice. Thinly traded, low-cap tokens like THQ carry outsized risk. Do your own research before investing.
Also read: