ETH Price Prediction: Bulls, Bears Fight for Control at $1,900


ETH Price Prediction: The $1,900 Trap Nobody Saw Coming This Week
Ethereum is trading near $1,959 today, up close to 4% over the past 24 hours. The move comes as the price pushes against a key resistance zone that traders have been watching for weeks.
The world's second-largest cryptocurrency has climbed more than 25% since it bounced off long-term support near $1,580. That level has held for months, and buyers stepped in hard once the price tested it again.
What is Ethereum's price doing right now?
On the daily chart, ETH/USDT is trading at $1,960.51, after touching a high of $1,962.77 and a low of $1,936.51. Volume sits around 52,410 ETH for the session.
Ethereum has been forming a rising channel pattern since early June. Price is printing higher highs and higher lows between two parallel trendlines, currently grinding toward resistance around $1,960 to $2,000.
The 20-day, 50-day, and 100-day EMAs are now stacked below price at $1,935, $1,842, and $1,863, respectively. That alignment usually points to improving short-term momentum.
The RSI reads 64.05, which is firm but not yet stretched into overbought territory.
Metric | Value |
Price | $1,960.51 |
24h Change | +3.93% |
Futures Volume (24h) | $31.55B |
Spot Volume (24h) | $1.16B |
Market Cap | $235.93B |
Open Interest | $28.18B |
Circulating Supply | 120.68M ETH |
Where is the resistance for ETH price?
If Ethereum breaks above the channel's upper trendline with strong volume, the next targets sit at $2,050 and then $2,100, near the channel's projected resistance.
The 200-day EMA currently sits higher, near $2,181.57, and could act as a further hurdle beyond that.
A failed breakout could send Ethereum back toward the $1,900 to $1,860 support band, near the channel's lower trendline. A deeper pullback would likely find buyers closer to $1,800.
What does the options market say about ETH?
Derivatives data adds more color to the picture. Ethereum's 24-hour futures volume stands at $31.55 billion, up 130.87% on the day, while open interest sits at $28.18 billion.
Options open interest for the July 27 expiry totals 19,827 contracts. That splits into 9,680 call contracts and 10,147 put contracts, giving a put/call ratio of 1.05.
Metric | Value |
Call Open Interest | 9,680 |
Put Open Interest | 10,147 |
Total Open Interest | 19,827 |
Put/Call Ratio | 1.05 |
Notional Value | $38,801,637.27 |
Max Pain Price | $1,900.00 |
The max pain price sits at $1,900, meaning most option holders would lose the most money if ETH settles right there at expiry.
Calls are concentrated between $1,900 and $2,025, showing traders expect upside. Puts cluster around $1,750 and $1,850, which points to hedging against a drop.
Long/short data on Binance also leans bullish, with a long/short ratio of 1.87 on accounts and top traders showing a ratio of 1.47.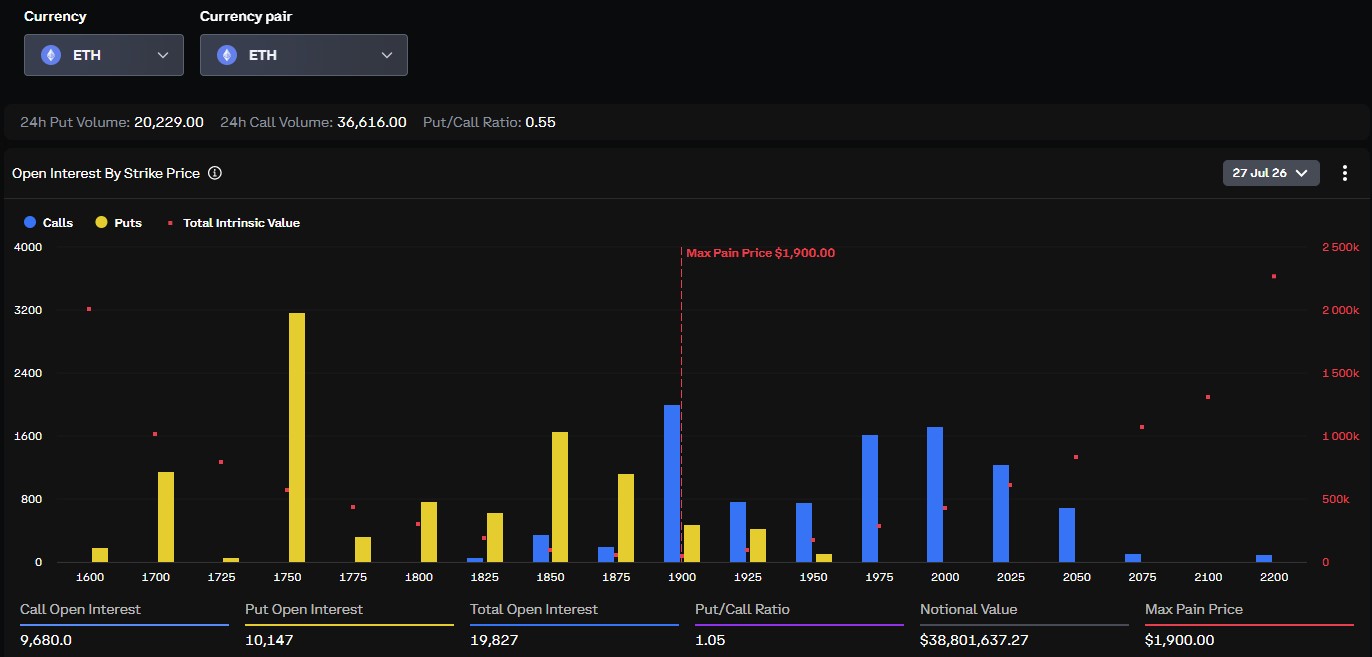
Are whales buying Ethereum right now?
On-chain activity backs up some of the bullish tone. Blockchain tracker Lookonchain reported that Arthur Hayes, the former BitMEX CEO, bought another 645 ETH worth roughly $1.2 million within the past day.
Since July 15, Hayes has bought a total of 3,915 ETH worth about $7.47 million, at an average price of $1,909. His position is currently down around $113,000, based on the reported figures.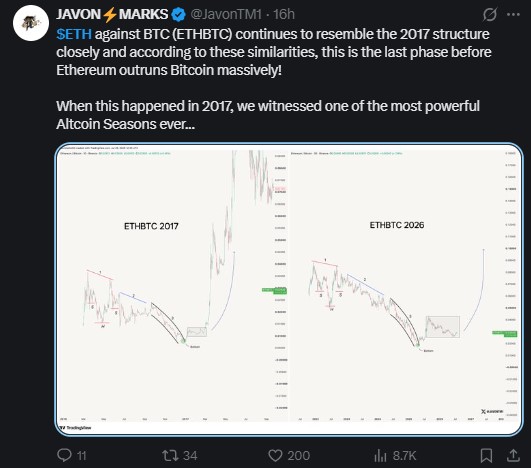
Does the ETHBTC chart support an altcoin season?
JAVON MARKS is also watching Ethereum's performance against Bitcoin. A widely shared chart from trader Javon Marks compares the current ETHBTC structure to the 2017 pattern, arguing that Ethereum could be entering its final phase before outperforming Bitcoin.
That 2017 setup was followed by one of the strongest altcoin rallies on record. Whether the 2026 pattern plays out the same way remains an open question, and traders should treat chart comparisons as one signal among many, not a guarantee.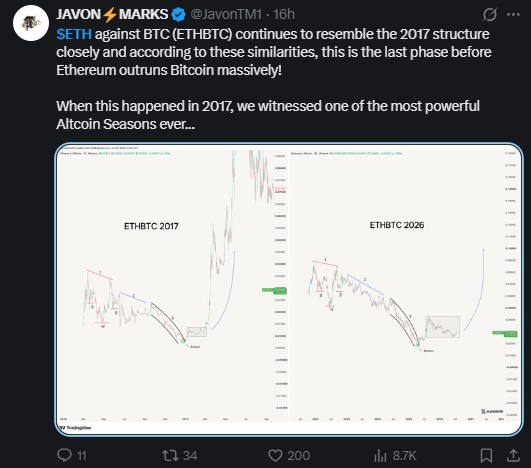
ETH price prediction: What's Next?
Ethereum's price action currently favors a cautiously bullish outlook as long as price holds above the rising channel's lower trendline near $1,900.
A clean breakout above $1,960 to $2,000 with strong volume could open the door toward $2,050 and $2,100, based on the channel's structure.
On the other hand, a rejection at resistance could send Ethereum back toward the $1,800 to $1,860 zone.
Traders will likely watch the $1,900 max pain level closely into expiry, along with whether whale accumulation continues.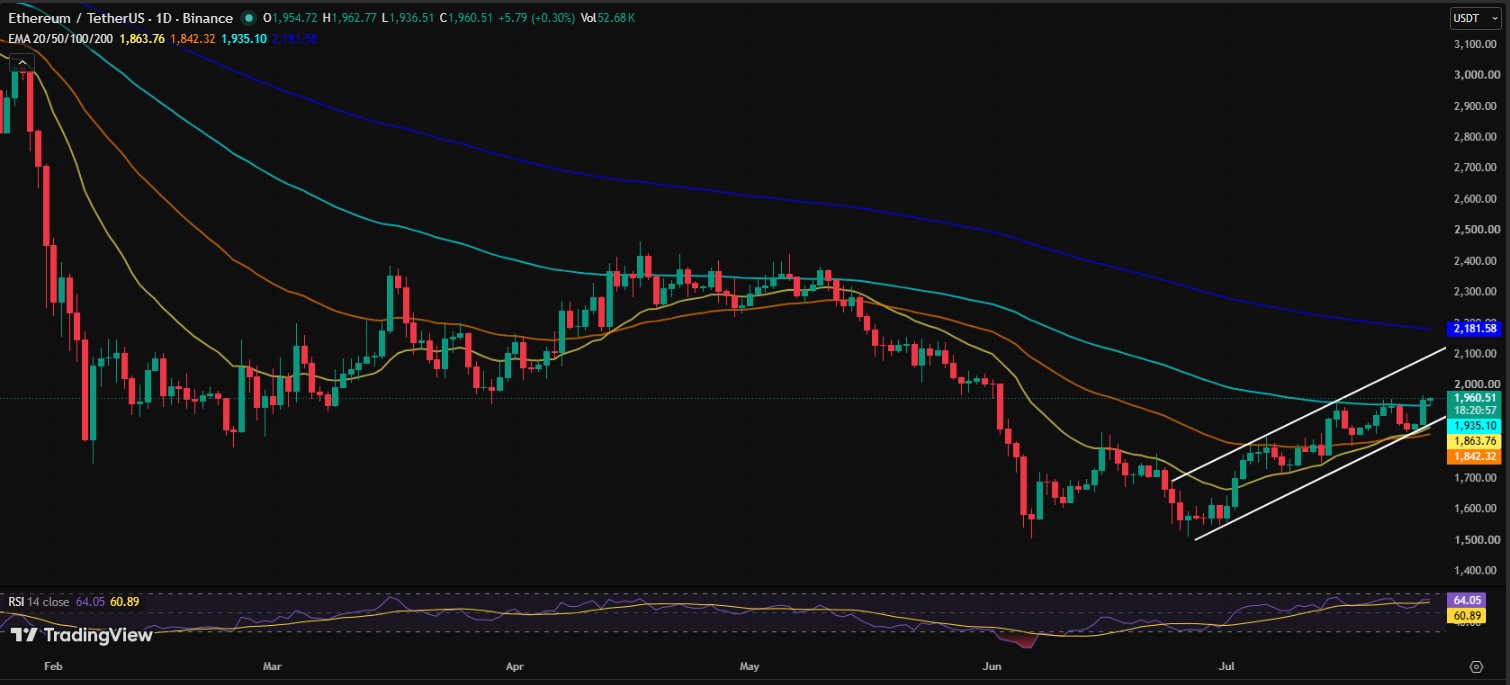
Disclaimer
This article is for informational purposes only and does not constitute financial, investment, or trading advice. Cryptocurrency markets are highly volatile, and prices can move sharply in either direction. Always do your own research and consult a licensed financial advisor before making investment decisions.
Also read: