Tria Price Prediction: Why Is TRIA Price Surging Today?


A small fintech token most traders had never heard of last week just jumped over 30% in a day, and the reason behind it is stranger than most people expect.
Why Is Tria Price Suddenly The Talk Of Crypto Twitter
Tria price prediction is the phrase everyone in smaller crypto circles is typing right now. It is not hard to see why.
The token moved from near obscurity to a double-digit daily gain almost overnight. Basically, one announcement changed the whole conversation around this coin.
$TRIA was trading close to its all-time low just one day before this rally started. That is not a small detail.
So what actually pushed the price? Was it hype, real usage, or something else entirely?
Turns out, the answer involves a card rewards campaign, not a chart pattern.
$TRIA Token Snapshot: Price, Supply, and Market Data Today
| Metric | Value |
|---|---|
| Coin Name | Tria |
| Ticker Symbol | TRIA |
| Blockchain | Ethereum (ERC-20) |
| Today High | $0.01051 |
| Today Low | $0.007749 |
| RSI Level | 52.34 |
| Token Type | Utility and Rewards Token |
| Token Category | Fintech |
| Market Cap | $22.47M |
| 24H Trading Volume | $12.41M |
| 24H Trading Volume Change | +73.88% |
| Circulating Supply | 2.15B TRIA |
| 24H Change | +30.35% |
Source: Data by CoinMarketCap
What Exactly Is $TRIA And Why Does It Even Exist
$TRIA is a card and payments platform on Ethereum that lets people spend crypto through everyday debit-style cards settled on-chain.
The pitch is simple: make crypto spendable, not just holdable. That angle, similar to how crypto exchanges have pushed card products before, is why people circle back on new promotions.
Tria Price History: How Far Has The Token Fallen And Bounced
$TRIA has had a rough few months. Its all-time high sits at $0.05084, hit back in March 2026, and the token is still down almost 80% from that peak.
But here's what most traders are missing. The all-time low was printed just one day ago at $0.007468, and the price already recovered over 39% from that floor.
That kind of bounce off a fresh low usually means fresh buyers stepped in fast.
Why This Coin Is Getting Real Attention Right Now
The immediate trigger is a campaign called July Spend Fest. Tria doubled cashback caps and card points across every tier until July 31, 2026, and the timing lined up exactly with the price move.
There's more going on too. Tria confirmed new perpetual futures markets through its Decibel integration, adding leveraged access to names like Alibaba, IBM and Netflix.
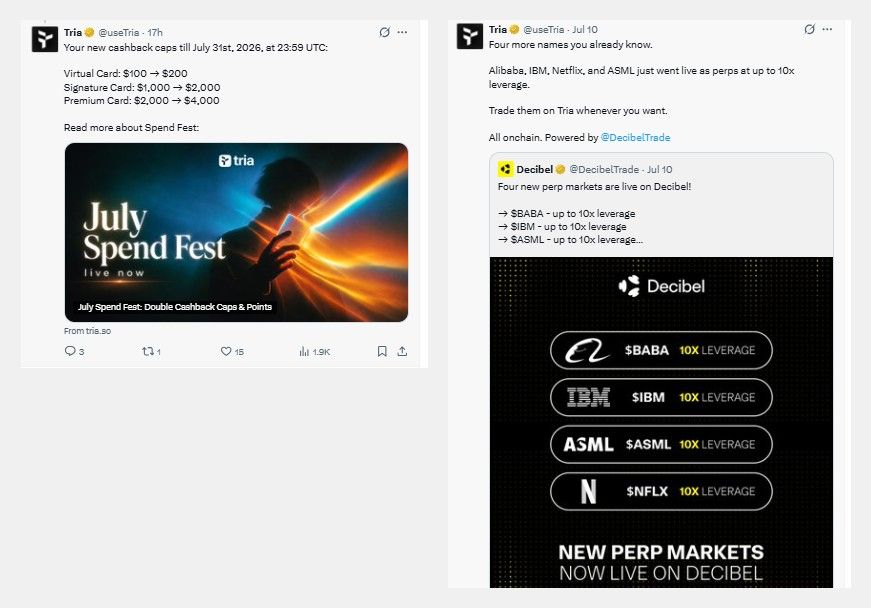
Source: Posted on X by Tria
That is a real product expansion sitting underneath the price spike, not hype without substance.
$TRIA Fundamental Analysis: Strength, Risk, and Holder Concentration
Here's the thing: the fundamentals are mixed. Real product usage and an active card business separate Tria from pure meme tokens.
But holder concentration is extreme. The top address alone controls 30.10% of the supply, and the top 100 wallets hold 99.10% between them.
One large wallet moving can swing this chart harder than any indicator.
Tria Technical Price Analysis: What The Chart Is Actually Saying
Breaking: $TRIA just broke out of a descending channel on the 4-hour chart. Buyers stepped in fast.
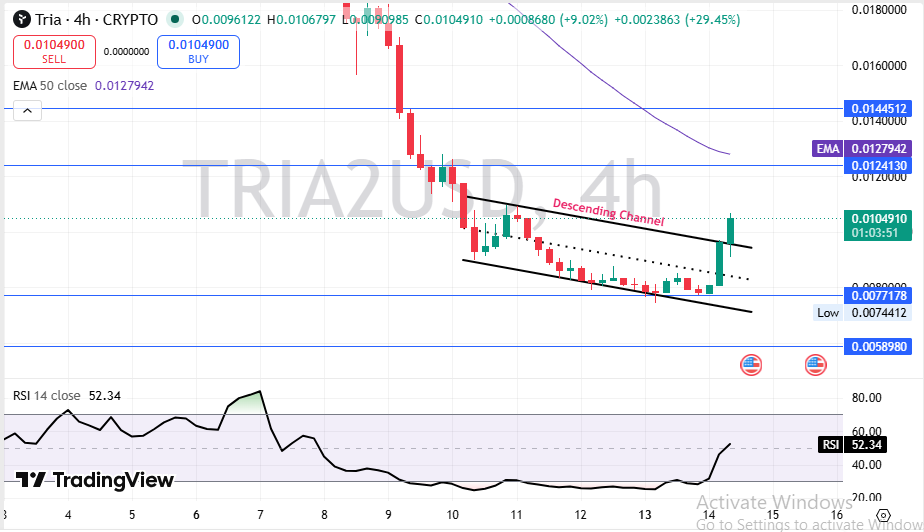
Source: Charting by TradingView
Price now trades below the 50 EMA at $0.0128. RSI at 52.34 sits in neutral territory, leaving room before anything looks overbought.
But the breakout candle has not closed yet. A weak close back inside the channel would undercut the bullish read fast.
Resistance sits at $0.01241 and then $0.01445.
Support sits at $0.00772, backed by a deeper floor at $0.00590.
Tria Versus Other Small Cap Fintech Tokens
Compared to other low-float fintech tokens, Tria's volume-to-market-cap ratio of 54.38% stands out as unusually high for its size. Most coins this small do not see that kind of turnover without a real catalyst.
The broader altcoin market trends have stayed quieter than $TRIA this week. That gap alone explains the extra attention.
$TRIA Short-Term Price Prediction: What Could Happen Next
Short-term price action will likely hinge on whether the Spend Fest promotion keeps pulling in new card users through the end of July, much like how a Bitcoin bull bear case hinges on catalysts rather than charts alone.
| Timeframe | Bearish Target | Base Target | Bullish Target | Key Trigger |
|---|---|---|---|---|
| 24 Hours | $0.0090 | $0.0105 | $0.0122 | Follow-through volume after breakout |
| 3–7 Days | $0.0080 | $0.0115 | $0.0135 | Weekly close above the EMA |
| 2–4 Weeks | $0.0075 | $0.0120 | $0.0150 | Spend Fest engagement data |
Watch the $0.0124 zone closely. It decides whether this turns into a real trend or fades.
Tria Long-Term Price Outlook: 2027 And Beyond
The long-term case depends far more on card adoption than chart patterns. Without new users, a spike like this fades once the promotion ends, the way past crypto market rally stories have shown.
| Timeframe | Bearish Target | Base Target | Bullish Target | Catalyst Needed |
|---|---|---|---|---|
| 3 Months | $0.0060 | $0.0110 | $0.0160 | Sustained card volume growth |
| 6 Months | $0.0050 | $0.0130 | $0.0210 | New exchange listings |
| End of Year | $0.0045 | $0.0150 | $0.0280 | Expanded perpetuals liquidity |
| 2027 Outlook | $0.0040 | $0.0190 | $0.0400 | Broader fintech partnership network |
Honest take: the long-term case is still unproven. Real, but fragile until user numbers back it up.
Three Tria Price Scenarios Traders Should Prepare For
Worst Case: The Spend Fest campaign ends and card usage drops back to prior levels, echoing the kind of pullback seen during the last recent crypto market crash. Price slips back toward the recent low near $0.0075.
Base Case: Card adoption holds steady and the token consolidates between resistance and support. The price hovers in the $0.010 to $0.013 range for weeks.
Best Case: New users stick around after the promotion, and perps' volume adds real fee revenue. Price pushes toward $0.018 or higher on sustained volume.
| Scenario | Price Range | What Triggers It |
|---|---|---|
| Worst Case | $0.0050 – $0.0075 | Promotion ends and user activity fades |
| Base Case | $0.0100 – $0.0130 | Steady adoption with sideways price consolidation |
| Best Case | $0.0150 – $0.0200 | Strong user retention supported by new exchange listings |
Key Tria Price Levels Every Trader Should Watch
Resistance zone: $0.0124 to $0.0145. A daily close above here on strong volume opens room toward the next leg up.
Support zone: $0.0077. This is the low that started the current bounce, so losing it again would sting.
Invalidation zone: below $0.0059. A close below this level would break the entire recovery structure.
Tria Analyst View And Final Thoughts On The Rally
When we pulled up the RSI on this chart, the first thing that stood out was how much room is left before overbought territory. That is not small for a coin that just moved 30%.
The weekly setup still needs confirmation. A close above the EMA near $0.0128 would tell a stronger story than today's intraday spike alone.
One factor to track beyond the chart: whether Ethereum ecosystem activity stays supportive, since Tria settles on Ethereum and gas conditions affect card costs.
Whale concentration remains the biggest wildcard. 98% of tokens sit with whale wallets, so one large sell order could undo weeks of work.
The most important level right now is $0.0124. Everything short term points back to that number.
That is the level that decides the next move.
Disclaimer: This article is for educational purposes only and does not constitute financial advice. Crypto markets are volatile. Consult your investment advisor before making any investment decision.

















