Tutorial Price Prediction: $TUT Aster Listing Buzz Effect


A quiet BNB Chain token, a brand-new perpetuals listing, and a wave of short sellers caught leaning the wrong way all landed in the same 48 hours, and traders noticed. What started as a routine exchange announcement turned into one of the sharper small-cap moves of August, and now everyone wants a Tutorial price prediction that actually holds up, not just hype. Turns out, the chart tells a messier story than the headline does.
Here's the thing: momentum and math don't always agree, and this week they're arguing loudly. We pulled the numbers, checked the wallets, and read the liquidation data so you don't have to guess where this goes next.
Why Traders Cannot Stop Talking About Tutorial (TUT) This Week
Searches for Tutorial price prediction spiked hard this week, and it's not hard to see why. TUT sat near multi-week lows for most of the summer, then a fresh derivatives listing flipped the mood almost overnight. But a listing alone rarely moves a chart this much, and latest crypto news around the sector shows similar rotations happening elsewhere too.
And then the liquidation data came in. Shorts got run over, and that forced buying added real fuel to a move that started as speculation. Nobody called this pump early, and that's worth saying plainly. Still, the timing lit a fire under an already thin-float token, and traders piled in fast, a pattern that shows up across broader price prediction whenever leverage gets involved.
Basically, this is a story about leverage turning into liquidity, then liquidity turning into candles on a chart. Instead of guessing, we're walking through what the price action, the wallet data, and the chart structure actually say once the noise settles. So does TUT's move hold up under its own weight, or is this another leverage-driven spike waiting to round trip?
Key Takeaways
TUT trades near $0.0452, up roughly 52-62% in 24 hours after Aster DEX listed TUT perpetuals with up to 5x leverage.
The daily chart shows an ascending channel breakout with RSI at 86.11, deeply overbought.
The weekly chart shows a consolidation-zone breakout with RSI at 81.87, still stretched but less extreme than the daily.
Resistance sits near $0.0532, then $0.0711; support sits near $0.0242, then $0.0080.
Top 100 wallets hold 98.99% of supply, a heavy concentration risk for a token this size.
Why Is Tutorial (TUT) Price Pumping Today
The short answer is leverage plus a squeeze. Aster DEX listed TUT perpetuals on Aug 6, and new leverage venues almost always pull in fresh speculative flow. Trading volume followed almost immediately, crossing $67.58M in a single day per Tutorial's market data, against a $37.67M market cap.
Macro conditions helped too. Renewed rate-cut hopes out of the latest Fed meeting commentary eased pressure on risk assets generally, and small-cap tokens like TUT tend to catch that tailwind first.
The Aster Perpetuals Listing Turned Heads First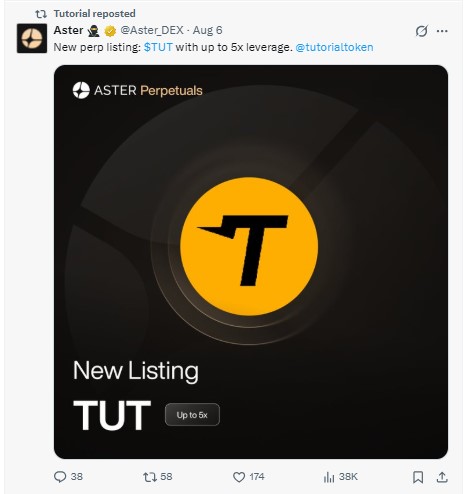
The Aster DEX listing post alone pulled thousands of views on X within hours, with up to 5x leverage offered on TUT from day one. That's real reach for a token most traders had not touched in weeks. And it happened right as TUT was sitting near a multi-month base, which made the pump sharper than it might otherwise have been.
Then a Short Squeeze Added Fuel
Separately, TUT liquidation data shows 24-hour liquidations near $438.76K, and shorts made up $380.62K of that. Traders betting against TUT got run over. Binance alone processed over $116.43M of the day's volume across spot and futures. That's how leverage-driven moves work.
Tutorial (TUT) Technical Analysis: Daily and Weekly Chart Breakdown
Data captured from MEXC via TradingView at 06:45 UTC on August 8, 2026.
Daily Chart Analysis
Zoom into the daily chart, and the picture runs hot. TUT carved an ascending channel through the summer, grinding higher for weeks before breaking sharply above it in the last two sessions. The full candle-by-candle view is visible on TradingView's live chart for anyone who wants to check it directly.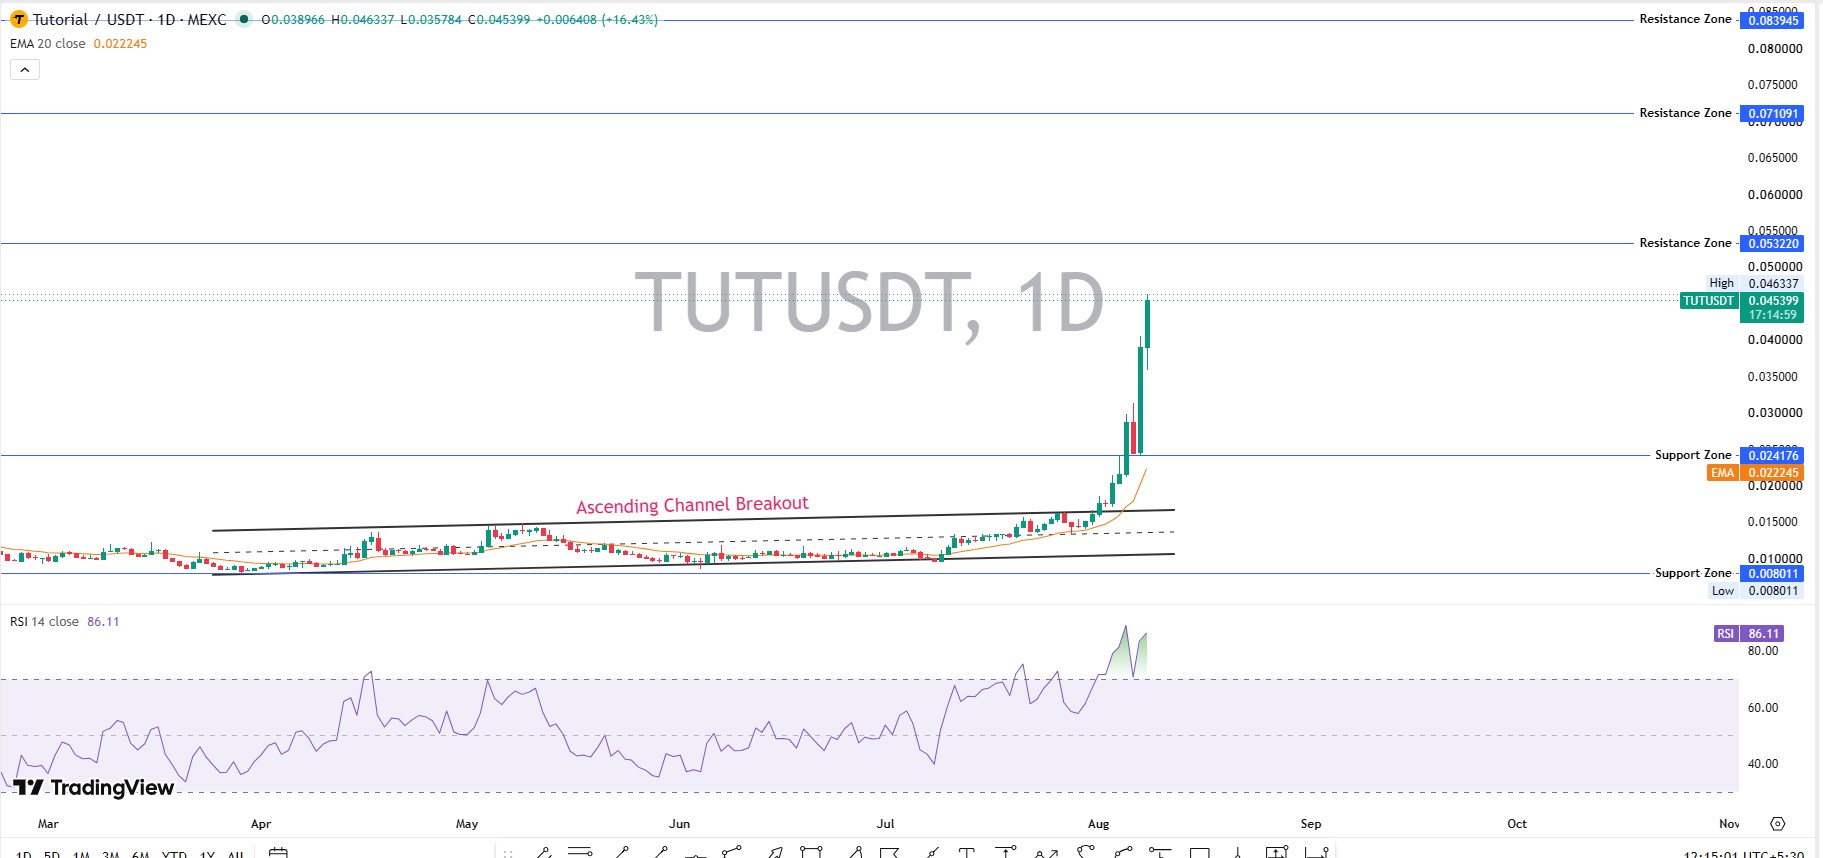
The move added over 16% on the latest daily candle alone, with price briefly touching $0.0463 intraday. EMA20 on this timeframe sits far below spot, near $0.0222, which shows just how fast this candle moved.
RSI here reads 86.11. That's deeply overbought, one of the hottest readings on the chart in months. Short pullbacks toward the $0.0242 zone wouldn't be shocking given that stretch. For context on how AI-linked tokens have behaved after similar spikes, AI token news is worth a scan.
But the broader channel-breakout structure still points higher over time, even if the next few sessions get choppy. Patience matters here.
Weekly Chart Analysis
TUT broke out of a multi-month consolidation zone on the weekly timeframe, a range that held roughly between $0.0080 and $0.0200 for most of 2026. Price closed the week near $0.0452, well above that range.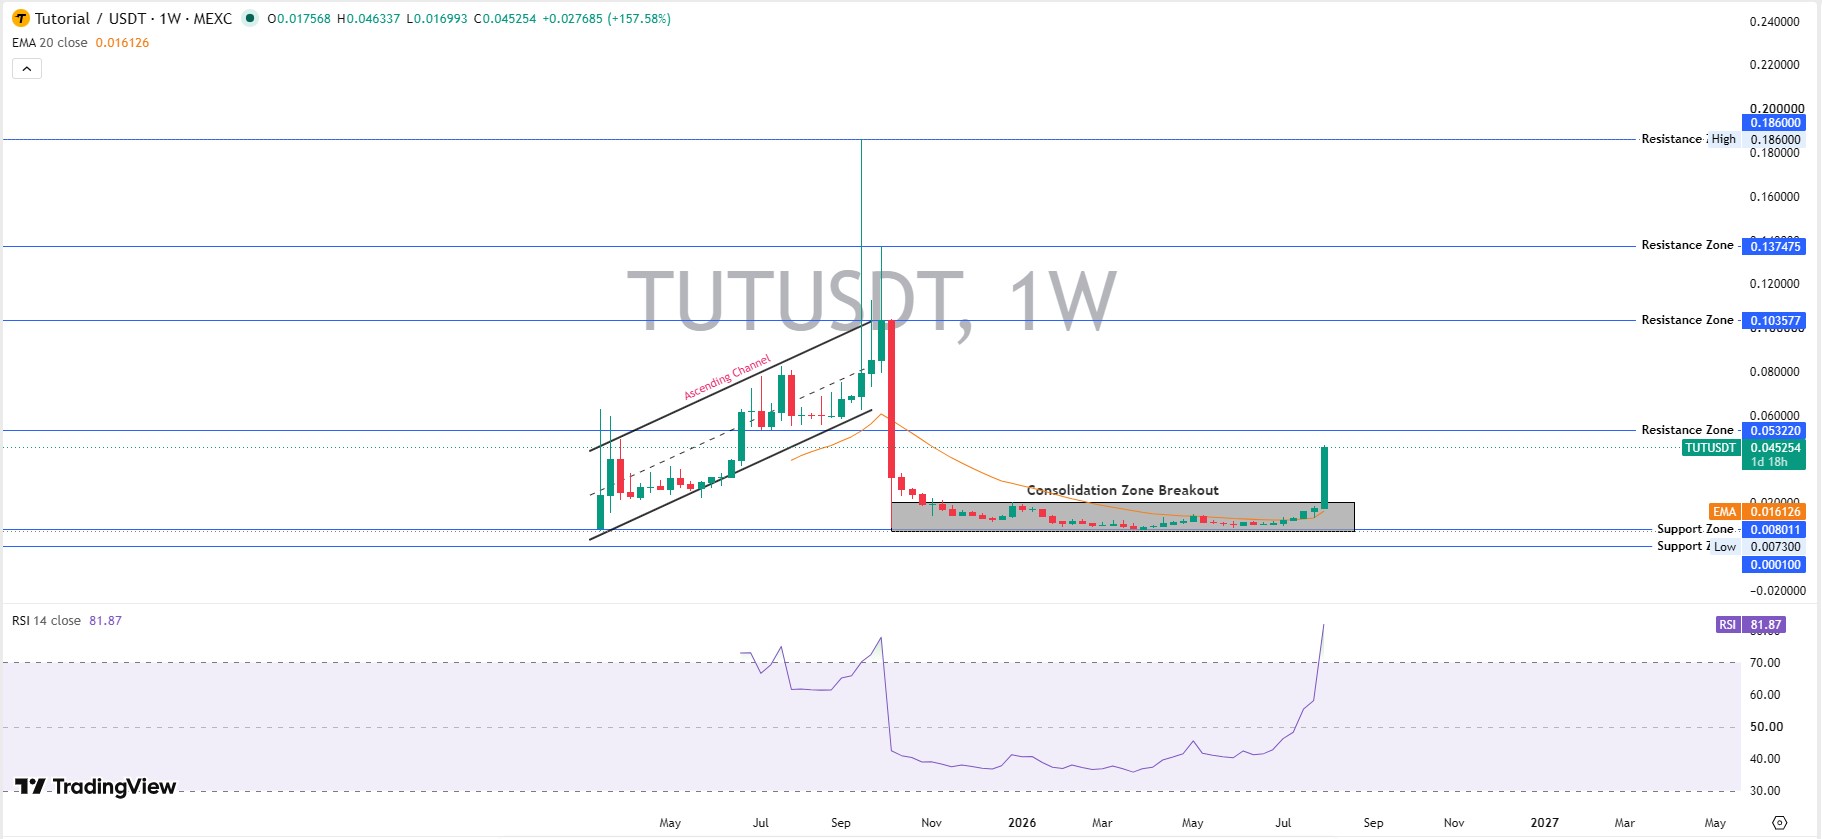
The weekly EMA20 sits at $0.0161, and the price has traded above it since the breakout candle. That's a decent sign for near-term trend health. Anyone tracking similar setups can watch the coin events calendar for upcoming listing or unlock dates that tend to trigger these breakouts.
RSI sits at 81.87, still overbought, though slightly less stretched than the daily reading. Resistance stacks at $0.0711, then $0.1036, then the $0.186 zone tied to an earlier weekly high. Support sits at $0.0080, a level that's held more than once, and it's the same floor the token bounced from during the summer consolidation.
Tokenomics and Whale Holder Data
BscScan's holder data shows 18,221 holders as of this snapshot. Top 100 wallets control 98.99% of supply, and whale wallets alone hold 86.60%, worth well over $32M at current prices. The Gini score reads 0.9992, about as concentrated as a token gets.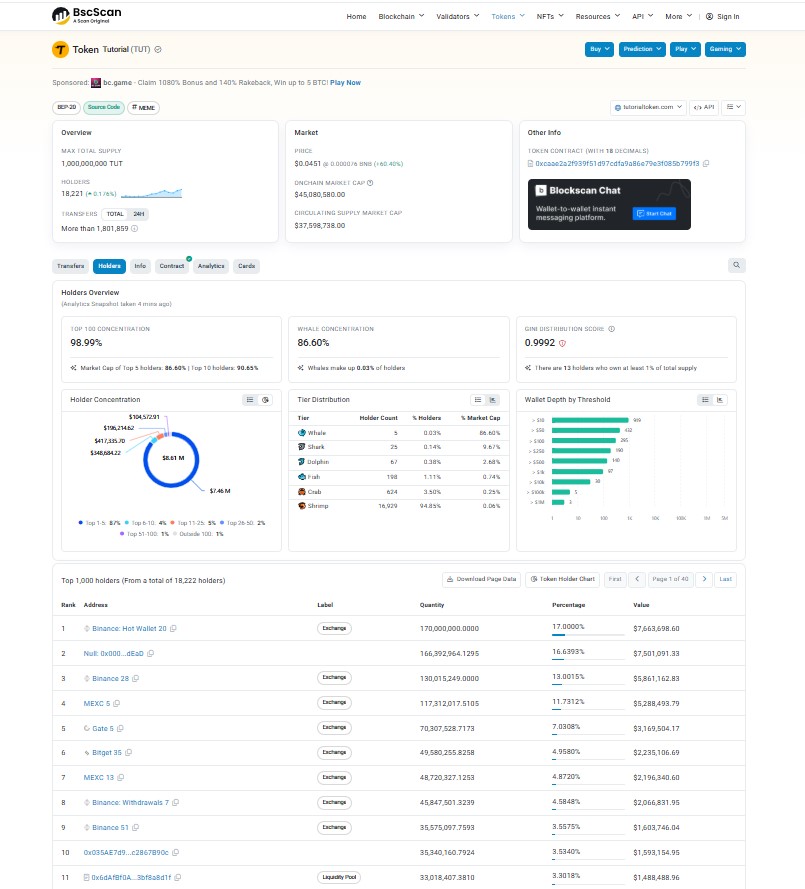
Just 5 whale wallets outweigh nearly 18,200 smaller holders combined. Several top wallets are exchange hot wallets from Binance, MEXC, and Gate, which is normal for a listed token, and the same venues appear on the exchange listing tracker most traders already use. Liquidity sits at 8.35% of market cap on CoinMarketCap's Tutorial page, a ratio worth watching rather than ignoring.
Altcoin Momentum: Why TUT Trades Like an AI Narrative Coin
Tutorial is not a pure utility token in the traditional sense; it positions itself around an AI-driven Web3 education product on BNB Chain, which puts it closer to the AI altcoin bucket than a fundamentals-first play. Here's the thing: when a fresh catalyst lands, like a new leverage listing paired with a short squeeze. Volume chases attention fast, sometimes faster than the fundamentals can justify.
Altcoin rotations like this usually run hot, then cool. TUT's move of over 150% from its recent weekly low fits that pattern closely, similar to how meme coin coverage has documented comparable spikes in thin-float tokens this year. Whether the next leg goes up or down probably depends more on sustained volume than on any single indicator.
Regulatory tailwinds matter here too. Progress on the Clarity Act Senate crypto vote has kept broader sentiment constructive, which gives smaller tokens more room to run when a catalyst like Aster's listing hits.
Is this rally sustainable, or is it borrowed momentum with an expiration date? That's the question every TUT holder should be sitting with right now.
Tutorial (TUT) Price Prediction: Bull, Base, and Bear Scenarios
Scenario | Timeframe | Price Level | Probability | Invalidation |
Bull | 30D | $0.0711 | 25% | Loses $0.0400 support |
Base | 7D | $0.0300 to $0.0530 | 45% | Holds current range |
Bear | 24H | $0.0242 | 30% | Breaks below $0.0350 with volume |
Our base case leans toward consolidation rather than an immediate breakout. The daily RSI is too hot to chase right now. And the weekly structure still has room, so dips into the $0.030 to $0.035 zone look more like opportunity than danger as long as the Aster listing narrative stays warm. We'd lean cautiously bullish over the next seven days, not neutral, and not blindly bullish either.
Key Risks and What Would Invalidate This Setup
Daily RSI near 86 means a short-term cooldown is likely before any fresh leg up.
Leverage-driven moves can lose momentum overnight once new-listing volume fades.
Whale wallets, even a handful, can move price sharply given how concentrated the supply is.
No sustained spot demand has been confirmed beyond the initial listing spike, and that speculative flow could unwind fast.
A daily close back below $0.0350 would break the current channel and open the door toward $0.0242.
For token-launch context and unlock schedules across the sector, the crypto airdrops tracker is worth a scan before sizing any position.
Disclaimer
This article is for informational purposes only and is not financial advice. Crypto assets, especially low-cap altcoins, carry high volatility and risk of total loss.
















