Tutorial Price Forecast: Can $TUT Reclaim $0.06?


Some charts move so fast that even people watching full-time have to double-check the decimal point. That's roughly what happened with a small education-focused token this week, and it's why the Tutorial price forecast conversation is suddenly everywhere.
What Just Happened With This Small Token Nobody Was Watching
TUT price prediction chatter exploded after this token nearly doubled in days, then gave a chunk of it back just as fast. Not the kind of move you shrug off.
We watched the order books shift in real time. Retail piled in, whales took profit, and the token settled into a tighter range.
Turns out, the story isn't just about a pump. It's about whether education-branded crypto can hold attention once the fireworks fade and whether this Tutorial coin price forecast still makes sense once the dust settles. Even a same-day TUT forecast 2026 has to weigh that question, not just the candles. So can it?
Key Takeaways
TUT jumped from roughly $0.029 to near $0.059, then pulled back to $0.042–$0.049.
The rally lines up with a PancakeSwap Farms Spotlight feature and meme-sector rotation.
Support sits near $0.028; resistance builds around $0.060 and $0.088.
Whale wallets, mostly exchanges, hold over 86% of supply, keeping volatility high.
This Tutorial TUT price prediction 2026 leans cautiously bullish short-term and neutral beyond 30 days.
Longer-range Tutorial price prediction 2027 targets stay speculative without new catalysts.
Why Is The Price Moving Today
Here's the thing: this wasn't random. Tutorial's official account confirmed a feature in PancakeSwap's Farms Spotlight alongside gold and tokenized equities, pulling fresh eyes toward the recent TUT listing surge.
And the memecoin sector was rotating hard the same week. On CoinGlass's meme dashboard, TUT posted the largest single-day gain in its category. Volume followed. So did liquidations: $1.78 million wiped out over 24 hours, per CoinGlass data. It's the kind of catalyst that keeps this Tutorial crypto price prediction moving faster than the fundamentals alone would justify.
Where Is The Price Right Now
As of August 18, 2026, near 14:00 UTC, TUT traded between $0.0428 and $0.0486, per CoinMarketCap, still up over 30% on the day despite slipping from an intraday high above $0.059. Anyone searching for a Tutorial price Forecast today is really asking about this exact range.
Market cap sits around $40 million, with 24-hour volume north of $200 million. That ratio is extreme. It tells us speculative money, not long-term holders, is driving price right now.
The all-time high of $0.2423 came August 10, 2026, just eight days before this snapshot. We're still nearly 80% below that peak.
Technical Analysis: Daily, 4H, and Weekly Chart Reading
Three timeframes, three slightly different stories. Here's how each one reads on its own, based on the latest TradingView candles.
4-Hour Chart: Ascending Channel Still Intact
The 4-hour candle opened at $0.048026, hit a high of $0.049138, and trades near $0.042985, down 10.58% on this shorter window. Sharper move, same direction as the daily.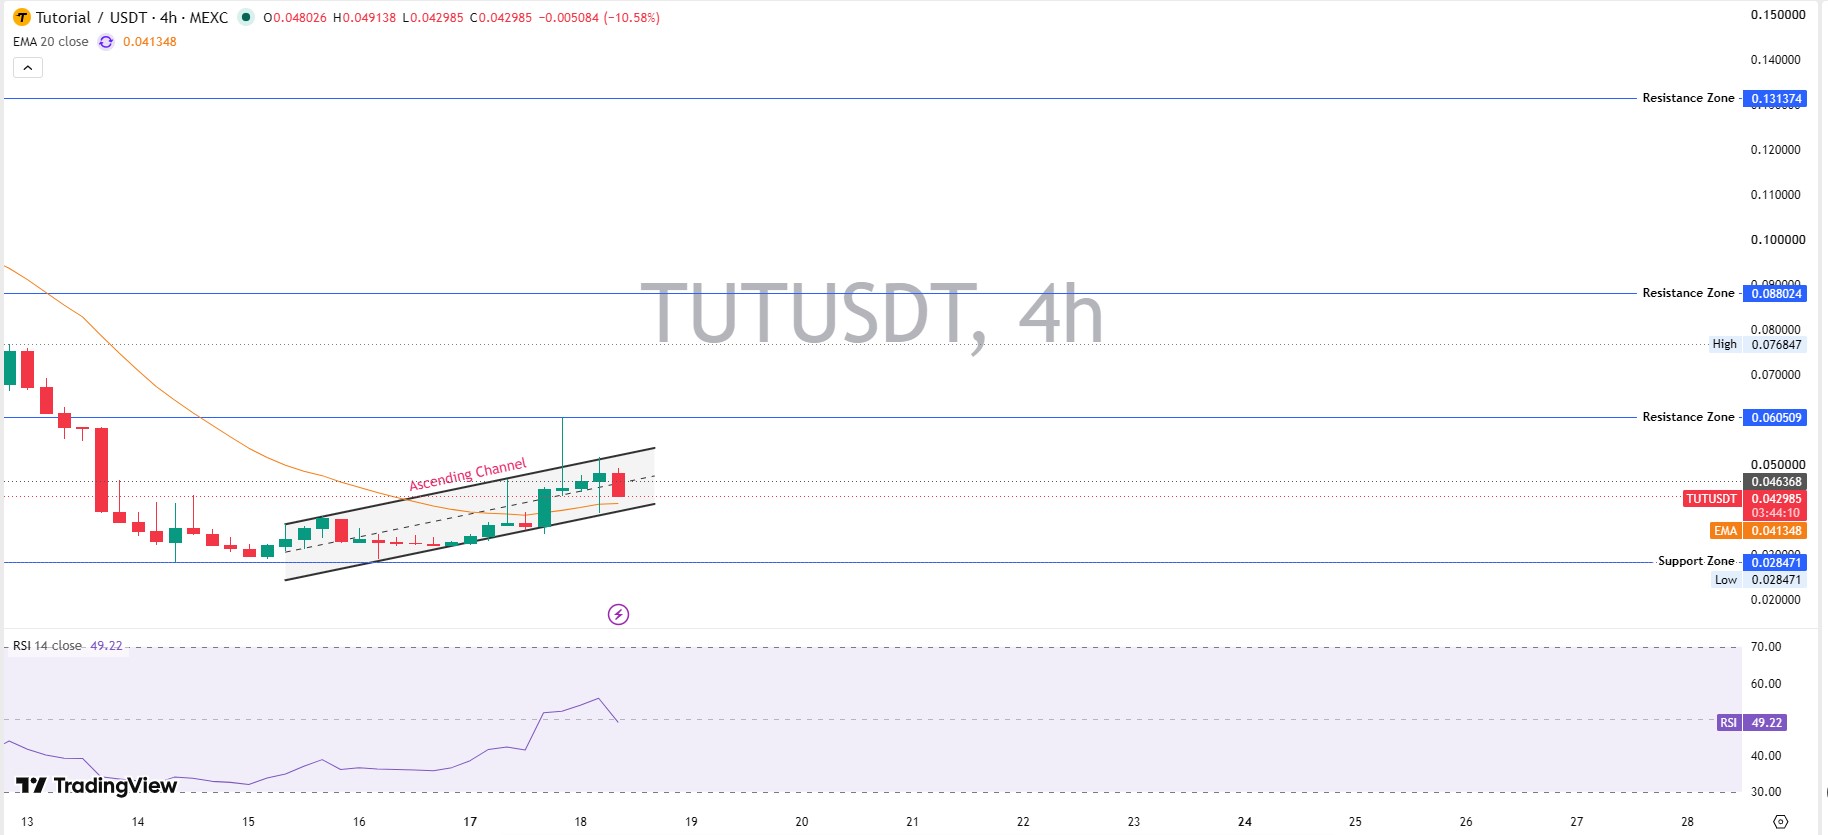
What stands out here is the ascending channel that's been forming since mid-August, with price bouncing between roughly $0.028 on the low end and pressing toward $0.0605 on the high end. RSI14 sits at 49.22, again neutral, and the current pullback looks like it's testing the lower rail of that channel rather than breaking it outright.
Resistance zones stack up above at $0.0605, $0.0880, and $0.1314. Each one would need a clean volume push to clear, and none of them have been tested seriously since the initial spike faded.
Daily Chart: Cooling Off Under The EMA
The daily candle opened at $0.046375, pushed as high as $0.051582, then faded to trade at $0.042036, down about 9.34% on the session. That's a rejection candle, not a breakdown one.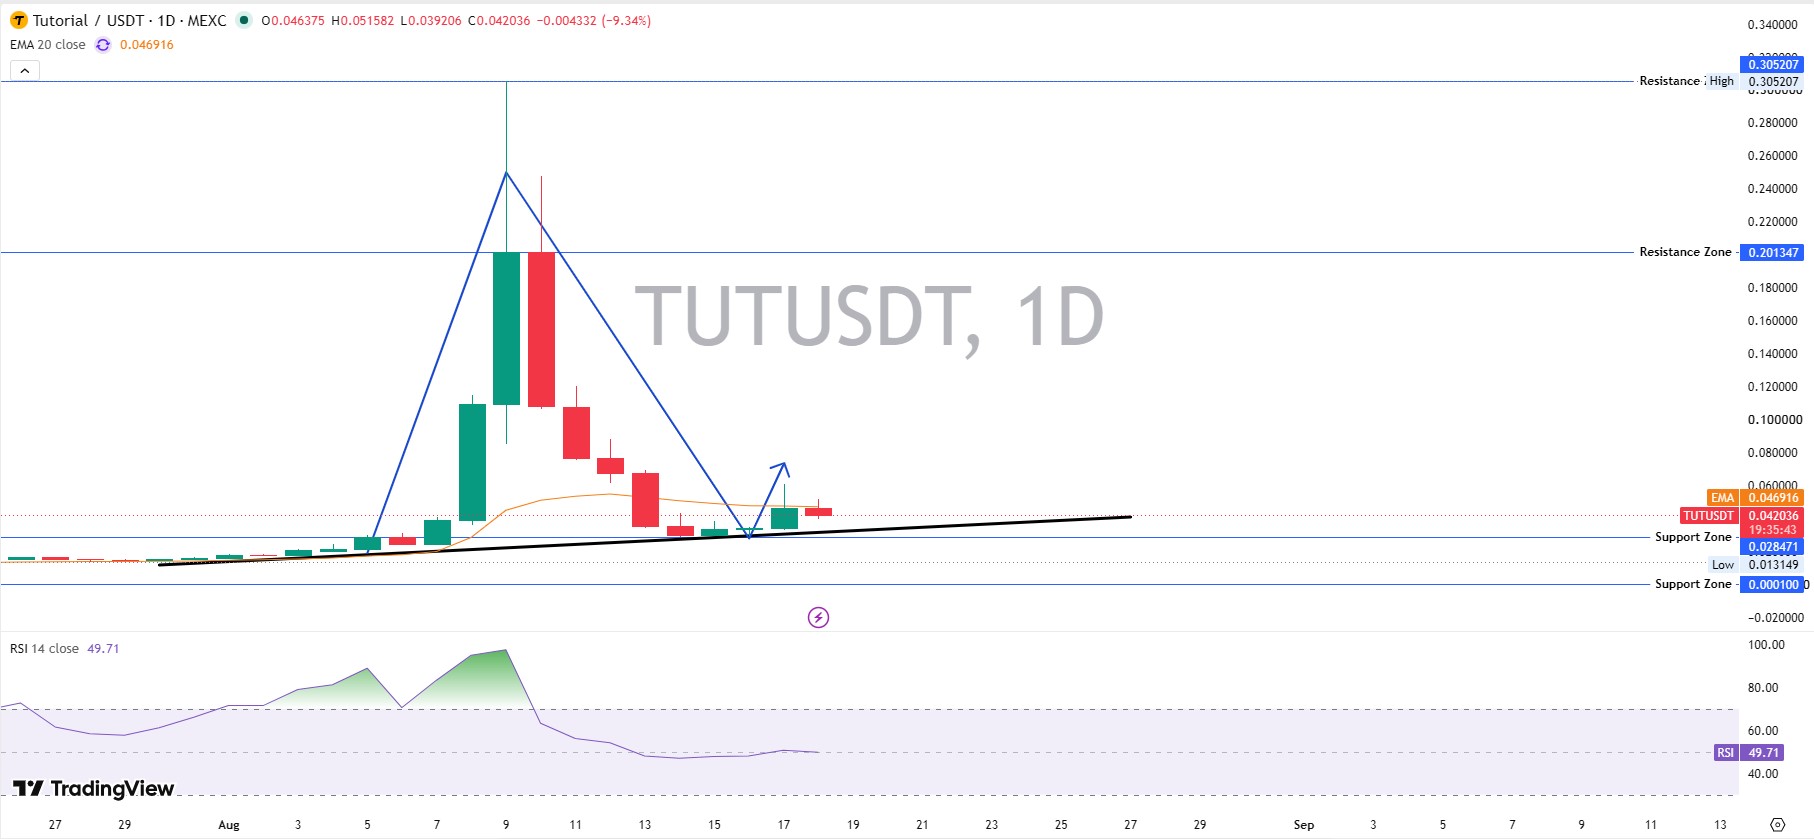
Price is now sitting just under its 20-day EMA of $0.046916, and that average has flipped from support into light resistance. RSI14 reads 49.71, dead center neutral, which tells us neither buyers nor sellers have real control right now.
Zoom out on the same chart, and the bigger shape matters more than today's candle. TUT spiked toward $0.26, formed a descending wedge down to the $0.028 support zone, then started carving a rounding bottom in mid-August. That base-building pattern is usually a slow, grinding process. It rarely resolves in a single session.
Weekly Chart: The Bigger Trend Still Holds
Zoom all the way out, and the weekly candle tells the most encouraging version of this story. It opened at $0.034246, ran to a high of $0.060509, and trades at $0.042576, still up 24.48% for the week. RSI14 sits at 52.14, mildly bullish.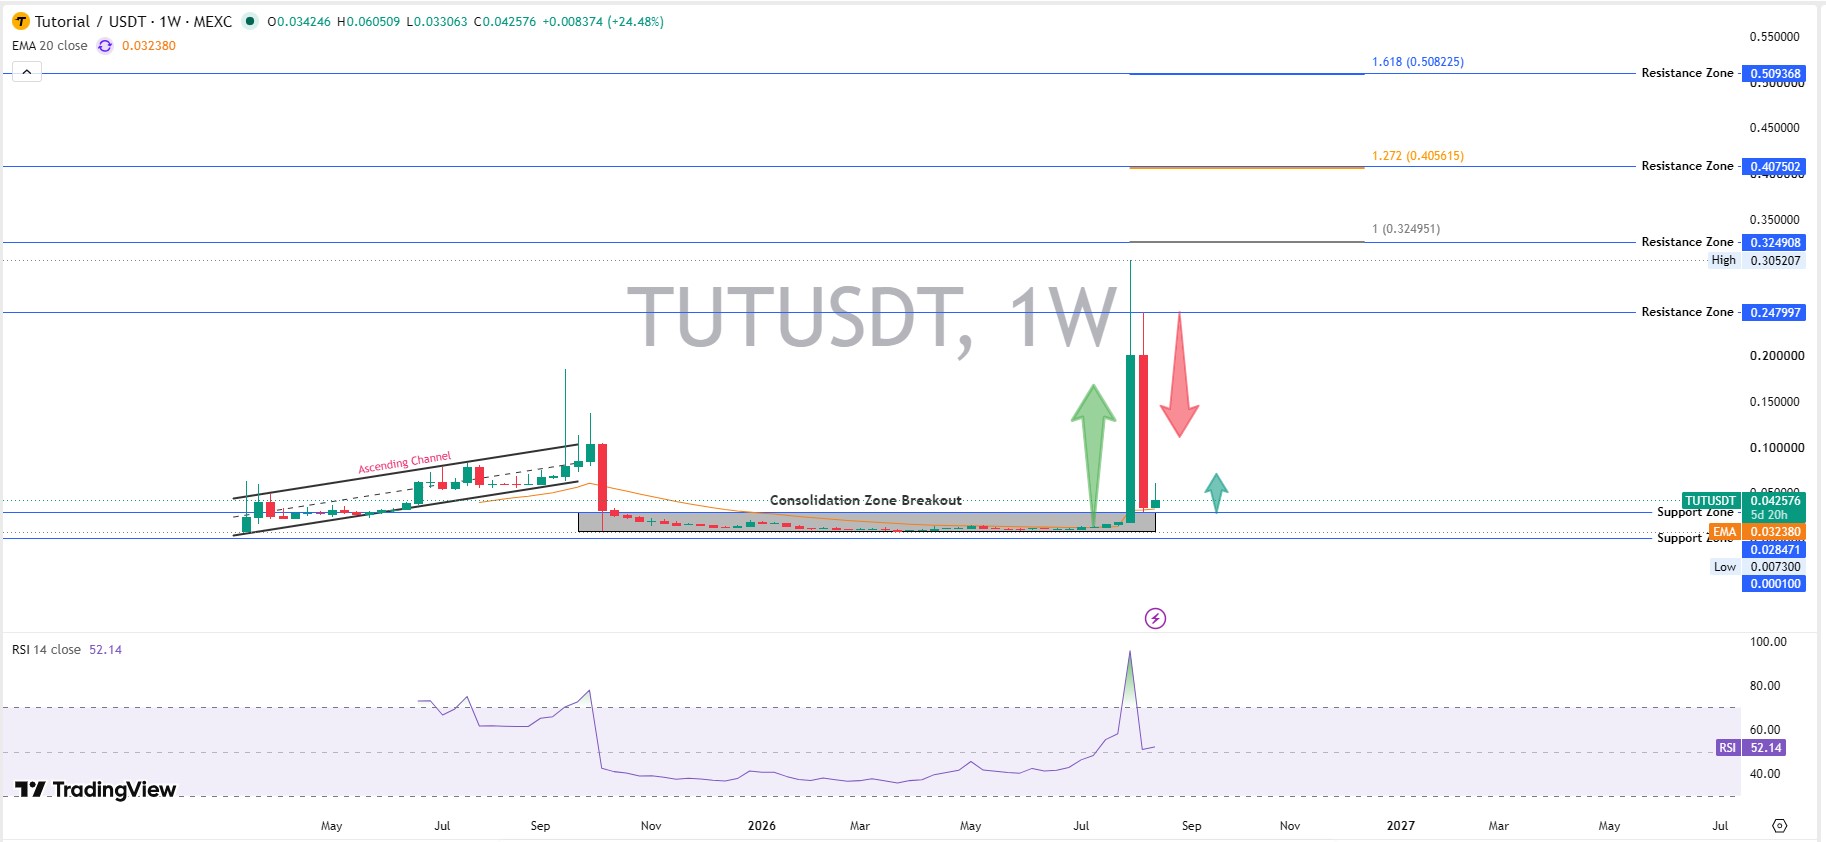
The price is holding above a wide consolidation zone that broke out after months of sideways chop and Fibonacci extensions from that base point toward $0.324908, $0.407502, and, in a stretch bull run, $0.509368. None of those are base-case targets. They're what happens if momentum genuinely returns.
Put the three together and there's tension. Daily and 4-hour charts are cooling off. The weekly chart hasn't broken its higher-low structure. That mismatch is exactly why a Tutorial price forecast this week has to lean on probabilities rather than certainty and why the price could easily look different by tomorrow.
Tokenomics And Whale Concentration
Circulating supply stands at roughly 832 million TUT against a 1 billion cap, giving an FDV near $48.6 million. The holder count is around 22,500, per BscScan. This is the supply picture behind any Tutorial token price forecast, and it matters more than the chart on its own.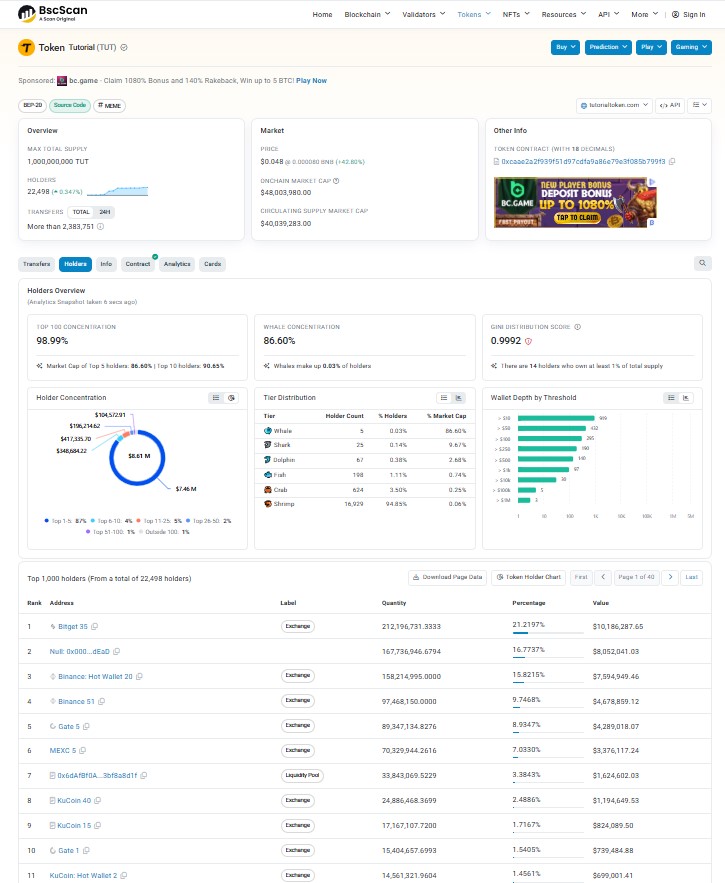
That sounds healthy until you check concentration. Top 100 wallets hold 98.99% of supply, and whales alone account for 86.60%. Most large addresses are exchange hot wallets, not private whales, which softens dump risk somewhat.
Still, a Gini score of 0.9992 is about as concentrated as it gets. Anyone tracking upcoming coin events should watch wallet movement before assuming stability.
Liquidity, Volume And Memecoin Sector Context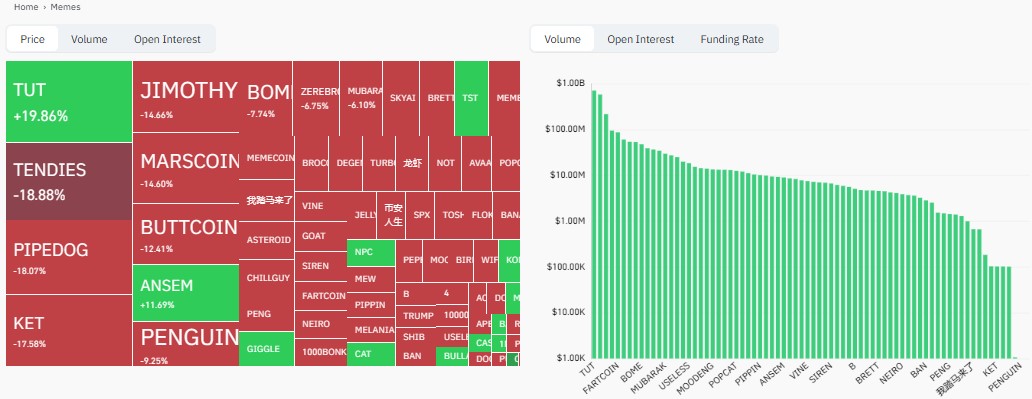
Liquidity against market cap sits at a reasonable 8.49%, and volume concentrates on Binance, which processed over $448 million versus Bitget's $76 million and Bybit's $56 million.
TUT sits under the memecoin category on major trackers, alongside names like Fartcoin and Bome in volume rankings. Memecoin liquidity evaporates fast once attention shifts, and the memecoin market news cycle moves in days, not months. TUT's education angle gives it a narrative edge over pure meme plays, but it still trades with meme-level volatility, which is why any Tutorial coin price prediction 2026 has to price in sudden swings.
Price Prediction: Bear, Base, and Bull Scenarios
This TUT price prediction for 2026 breaks down into three windows: the next 7 days, the next 30 days, and early 2027. That 30-day view doubles as a Tutorial price forecast next 30 days for anyone planning a shorter hold. Anyone hunting for a Tutorial TUT price prediction 2027 specifically, or a TUT price prediction for 2027, will find it in the last row.
Timeframe | Bear Case | Base Case | Bull Case | Probability | Invalidation |
7 Days | $0.012–0.018 | $0.022–0.032 | $0.045–0.063 | Bear 30% / Base 45% / Bull 25% | Daily close below $0.020 |
30 Days | $0.0129 | $0.025–0.045 | $0.063–0.084 | Bear 30% / Base 45% / Bull 25% | Weekly close below $0.0129 |
Early 2027 | $0.0076 | $0.030–0.060 | $0.105–0.118 | Bear 25% / Base 45% / Bull 30% | Loss of higher-low structure since August 2026 |
Risks To Watch
Whale-dominated supply means a handful of exchange withdrawals could tank price without warning. Fine. That's the trade-off with any low-cap token this new.
Memecoin sentiment can flip inside a single session. And regulatory attention on education-branded tokens is still unanswered. For broader context, the latest crypto news cycle has been active around smaller-cap listings lately.
Glossary
RSI: momentum indicator showing whether an asset is overbought or oversold, on a 0-100 scale.
EMA: a moving average weighted toward recent price action.
FDV: market cap if the entire max supply were circulating.
Gini Score: wallet concentration measure; closer to 1 means fewer holders control more supply.
Conclusion
Whales control most of the supply, volume is thinning after the spike, and the daily chart is still cooling off. But the weekly structure hasn't broken.
This Tutorial TUT price prediction for 2026 stays cautiously constructive above $0.028 and turns defensive below it. For readers comparing timeframes, other price prediction reports cover similar setups across other tokens.
Community sentiment, based on the project's own posts, still frames this as a long build over a quick flip. Markets move fast. Whether the Tutorial token future price catches up to that mission is the part nobody can chart yet.
Disclaimer: This article is for informational purposes only and does not constitute financial, investment, or trading advice. Cryptocurrency markets are highly volatile, and low-cap tokens like TUT carry elevated risk, including thin liquidity and concentrated wallet ownership. Always do your own research and consult a licensed financial advisor before making investment decisions.







.webp)








