Tutorial TUT Price Forecast: Why Did $TUT Surge 52% Overnight


A wild green candle can make anyone stop scrolling. That's exactly what happened with Tutorial, and the Tutorial TUT price forecast conversation is suddenly everywhere. Traders who ignored this token last week are now asking the same question on repeat.
We've seen tokens spike and vanish before. But something about this move feels different, and it's not just the candle.
Small Token, Big Weekend Move
Tutorial went from a quiet BSC project to a trending ticker in days. Nobody saw this coming, not even the loudest voices on crypto Twitter.
Here's the thing: momentum like this rarely comes from nowhere. There's a story behind it, and it involves a listing, a burn, and a community that refuses to sit quiet. Catalysts like this often surface first on an upcoming coin events calendar before the price catches up.
So where does TUT actually go from here? Keep that question in your head as we walk through the numbers.
Key Takeaways
TUT trades near $0.187, up roughly 25% over 24 hours as of August 10, 2026, 18:44 UTC.
Daily RSI sits at 91.25, deep in overbought territory that often precedes a cooldown.
Resistance sits near $0.305, with a bigger wall at $0.40.
Support holds around $0.085, with EMA20 near $0.058, far below the current price.
Tokenomics show roughly 16.67% of max supply already removed from circulation.
What Triggered the Move
TUT's rally lines up with growing chatter around an Aster exchange listing, something the community flagged well before the price reacted. Our detailed breakdown of the Aster listing price impact covers this catalyst in far more depth.
And there's a second layer here. The project's own account posted a tokenomics update, noting supply had dropped from a 1 billion max to 833.3 million tracked tokens. That's about 166.7 million tokens gone, roughly 16.67% of the original max. Price gets headlines. Tokenomics tells the longer story, as the team itself put it in a recent post covering the token's supply reduction. Updates like this tend to surface first in latest crypto news today roundups before charts react.
The team laid out the exact numbers in a recent tokenomics thread, confirming the burn math down to the token.
Market Snapshot
At the time of writing, TUT trades around $0.187, up over 25% in 24 hours, with market cap near $155.8 million and volume near $886 million. That volume to market cap ratio, above 470%, is unusually hot. You can track live movement on the TUT trading chart directly.
The all-time high sits at $0.2423, set just hours before this snapshot. The all-time low was $0.0002551, back in February 2025. That gap tells its own story, and it's worth checking an exchange listing tracker to see what's pulling fresh volume across venues.
Technical Chart Analysis
Short-Term (Daily Chart)
TUT broke out of a long consolidation zone that had capped price near $0.01 for months, and that breakout candle alone tells you volume showed up in force. 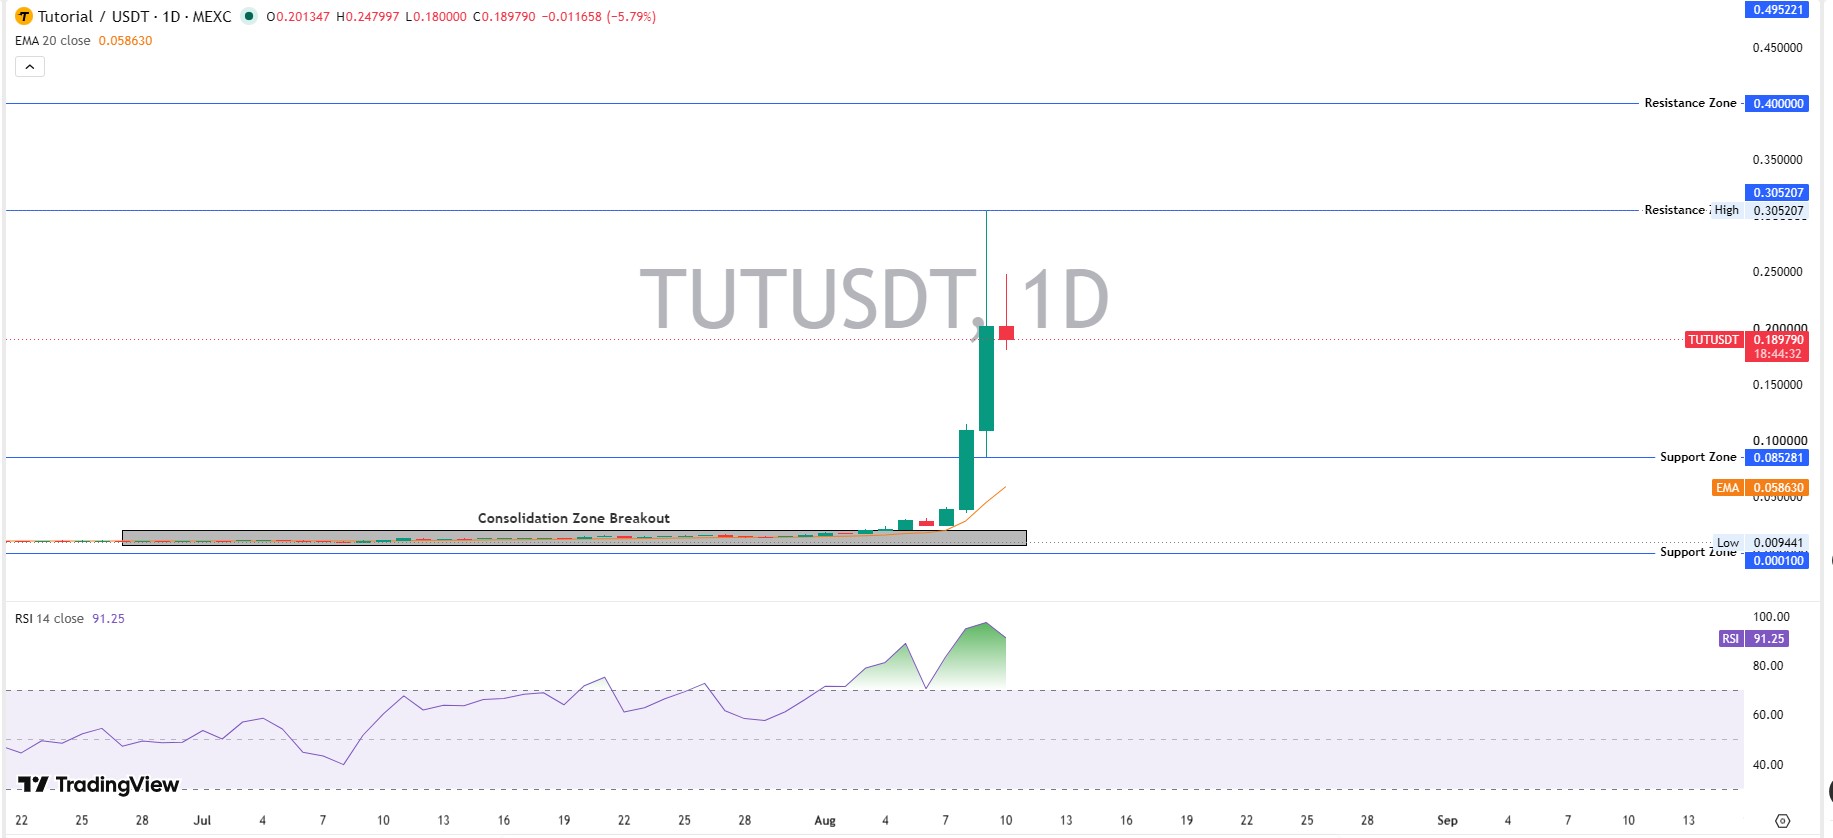
Daily RSI at 91.25 is stretched about as thin as it gets, sitting well above the overbought line for over a week now. A pullback toward the $0.085 support zone wouldn't be shocking, and it might even be healthy.
EMA20 sits far below current price near $0.058, which shows just how extended this move already is. Resistance sits at $0.305 first, then $0.40 above that. This move is fast, and fast moves tend to cool off just as quick. But until sellers actually show up on the tape, dips are getting bought.
Long-Term (Weekly Chart)
The weekly view shows an ascending channel from earlier in the cycle, followed by a long sideways grind, then this fresh breakout candle that dwarfs everything before it.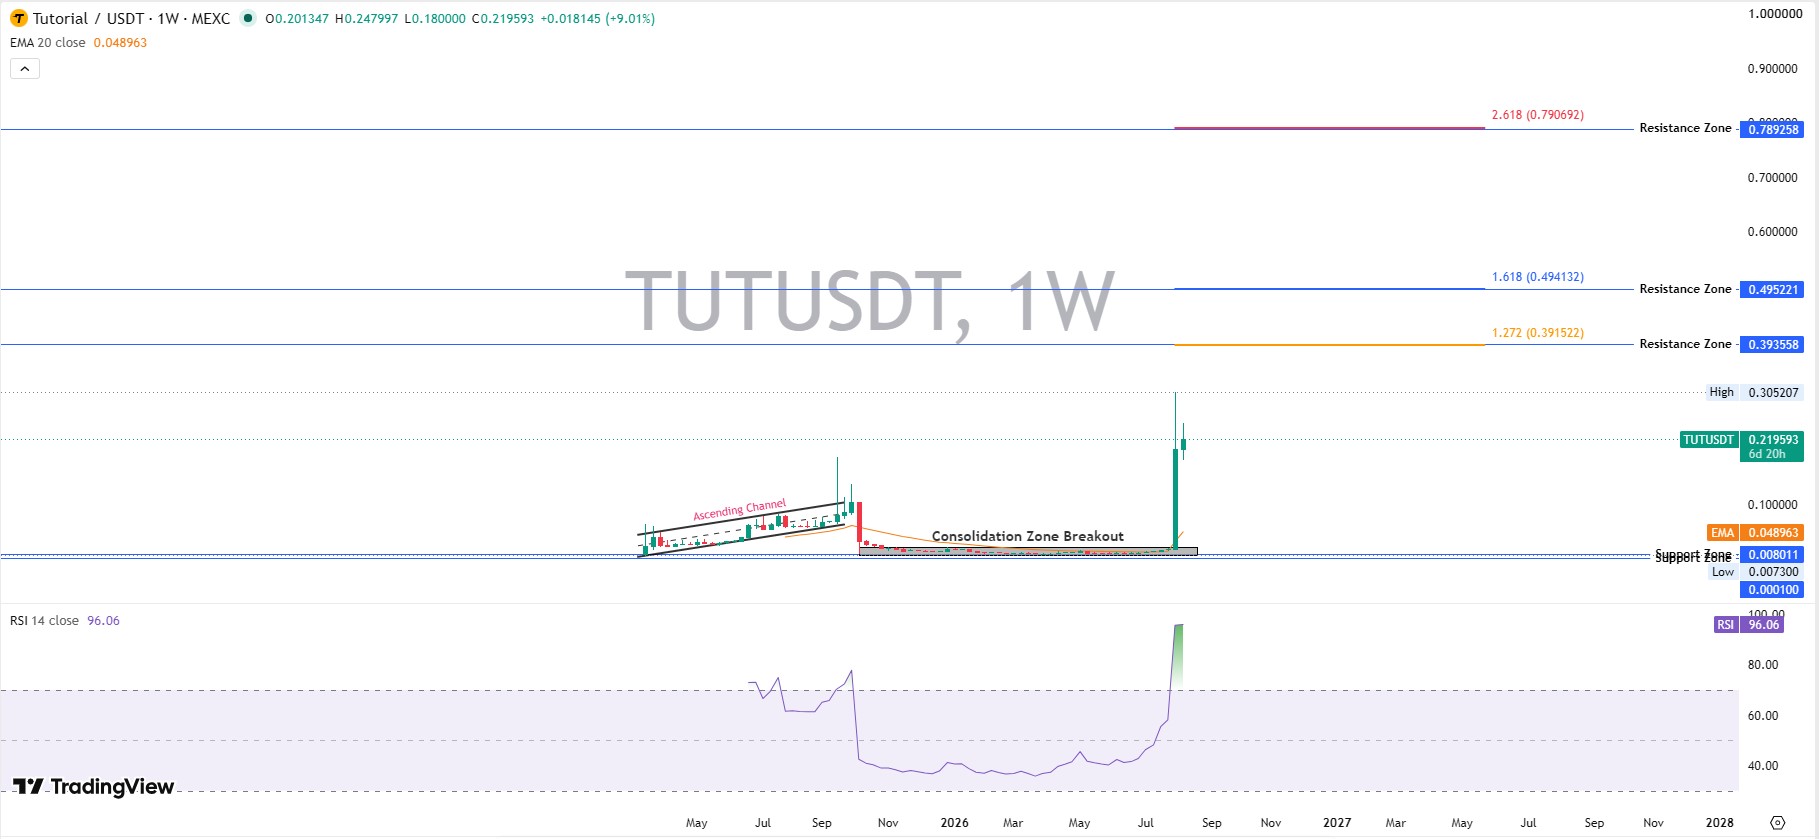
Weekly RSI at 96.06 is about as extreme as a chart can print, and readings this high rarely hold for long without some kind of cooldown week.
Fibonacci extensions place resistance near $0.393. then $0.495, then $0.789 if bulls somehow keep control through multiple targets. That's a lot of ground to cover. But weekly candles this stretched usually need weeks to digest, not days, so patience matters more than chasing the wick here.
Tokenomics and Supply
Circulating supply stands at 833.13 million against a 1 billion cap, per CoinMarketCap's live TUT page. Holder count is climbing too, past 20,000 wallets. Turns out, a shrinking supply paired with rising demand is exactly the setup that fuels sharp candles like this one.
Growing holder counts like this sometimes bring extra perks too. Communities this active often reward early supporters through crypto airdrop opportunities, something worth tracking alongside supply data.
Whale Concentration
This is where caution enters. Top 100 wallets hold 98.99% of supply, and whale wallets alone make up 86.60%. The Gini score reads 0.9992, about as concentrated as it gets. Full wallet data sits on BscScan's token holder page, and most top wallets are labeled exchanges, which softens the risk slightly but doesn't erase it.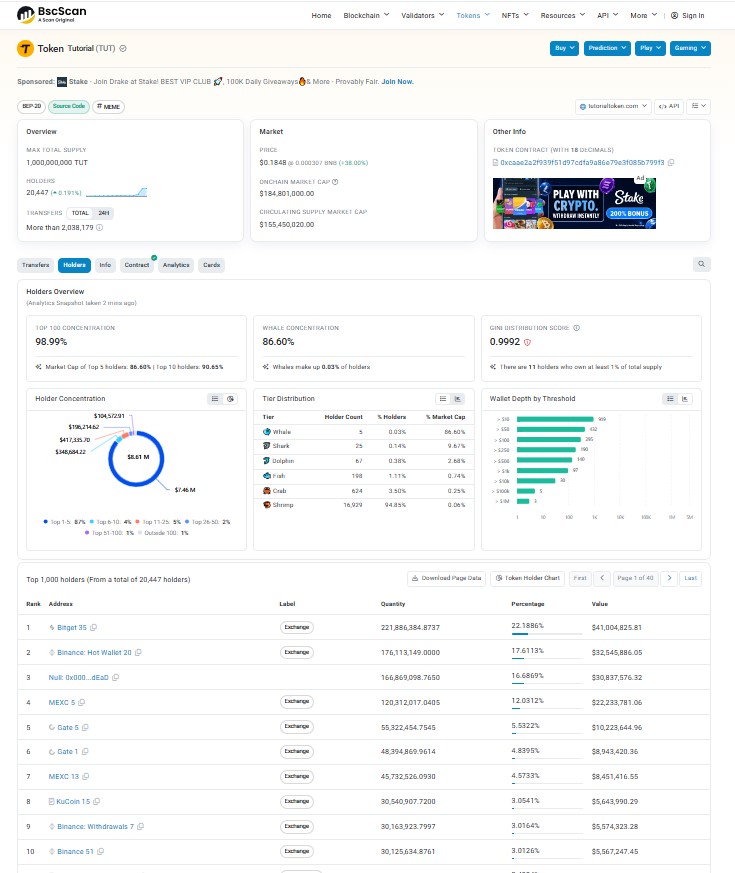
Liquidation data adds more texture. Over the past 24 hours, short positions absorbed roughly $39.73 million in losses versus $3.86 million on longs, per Coinglass liquidation tracking. Shorts got squeezed hard.
Memecoin Momentum on BSC
Tutorial carries a memecoin-adjacent origin story. It started, according to a pinned update from the project, as a literal tutorial video on deploying a token on BNB Smart Chain, and it snowballed into a real community.
BSC accounted for 27.3% of new token creations since 2025, and this kind of grassroots memecoin narrative tends to attract fresh momentum. For broader context on this corner of the market, memecoin market coverage tracks similar breakouts.
Forecast Table
Timeframe | Bear Case | Base Case | Bull Case | Probability | Invalidation |
7D | $0.09 | $0.16 | $0.24 | Bear 30% / Base 45% / Bull 25% | Break below $0.085 |
30D | $0.06 | $0.20 | $0.40 | Bear 25% / Base 45% / Bull 30% | Loss of $0.058 EMA |
Early 2027 | $0.05 | $0.30 | $0.79 | Bear 30% / Base 45% / Bull 25% | Loss of $0.085 support and falling holder growth |
Risks
Volatility is severe here. Whale concentration, thin real liquidity relative to volume, and an overbought weekly chart all raise the odds of a sharp reversal. Anyone tracking a broader Bitcoin price prediction 2026 outlook knows altcoins this small often move on borrowed momentum from majors.
Correlation with majors matters here too. When Ethereum price outlook shifts, smaller BSC tokens like TUT often feel the ripple within hours.
Glossary
RSI measures momentum and flags overbought or oversold conditions. FDV is fully diluted valuation, price times max supply. The Gini score measures how unevenly tokens are distributed among wallets.
Disclaimer: This article is for informational purposes only and isn't financial advice. Crypto markets are volatile; always do your own research.

















