Uniswap Price Prediction: $UNI $3.5T Volume in Focus, Major Rally Soon


Uniswap (UNI) is the governance token behind the largest decentralized exchange in crypto, and UNI just broke down from an ascending trendline it had been holding since early August.
This Uniswap Price Prediction looks at whether UNI can reclaim that trendline and bounce or whether the breakdown has further run.
Over the next few days, the bullish case needs a close back above $3.7757 and both key EMAs, while a break below $3.4534 would open the door to a much deeper move lower.
Here's what the chart and the latest Uniswap update show. Market data was checked on August 13, 2026, at 16:06 IST.
Uniswap Price Prediction Today: Market Overview
Metric | Value |
Price | $3.5975 |
24h Change | +2% |
Market Cap | $2.24B |
FDV | $3.2B |
24h Volume | ~$178.7M |
Vol/Mkt Cap (24h) | 8.01% |
TVL | $3B |
Market Cap/TVL | 0.7455 |
Total Supply | 891.37M UNI |
Max Supply | No fixed cap |
Circulating Supply | 624.13M UNI |
Source: Data from CoinMarketCap as of August 13, 2026, at 16:06 IST. Figures may vary slightly across other tracking websites.
Latest Uniswap News: New Dashboard Highlights DEX Dominance
Crypto data platform Blockworks announced it is now tracking Uniswap with a dedicated dashboard covering the protocol's financials, volume, liquidity, integrations, and security record. 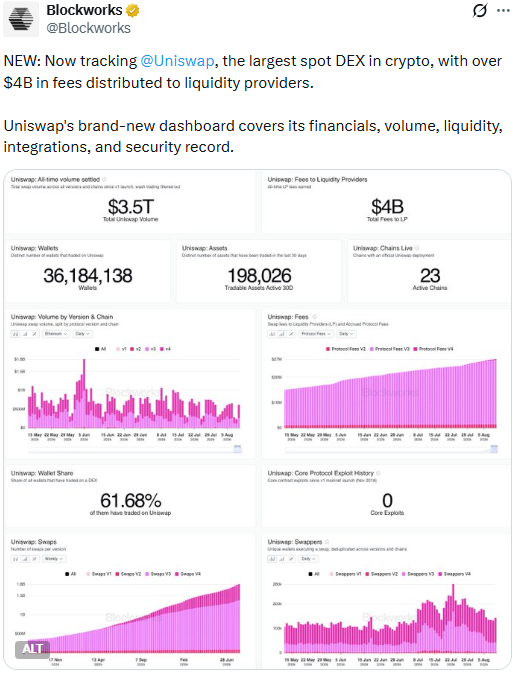
Source: Data From X
According to the dashboard figures shared by Blockworks, Uniswap has settled $3.5 trillion in all-time volume and paid out $4 billion in fees to liquidity providers.
The dashboard also shows over 36.18 million distinct wallets have traded on Uniswap, spread across 23 active chains, with Uniswap commanding a 61.68% share of DEX wallets that have traded on any decentralized exchange.
Blockworks' data also points to zero core protocol exploits since Uniswap's original 2018 launch.
None of this news changes the near-term technical picture below, but it underscores Uniswap's scale as the largest spot DEX in crypto.
UNI Price Prediction Chart: Technical Analysis
Pair: UNI/USDT · Market: Spot (Crypto) · Exchange: KuCoin · Timeframe: 4H · Source: TradingView · Timestamp: August 13, 2026, 16:06 UTC+5:30
UNI is trading at $3.5975, after breaking down sharply from an ascending trendline that had held since August, dropping into a small descending channel just above the $3.4534 support.
Both EMAs (Exponential Moving Average, a momentum indicator that weights recent candles more heavily) now sit well above the current price, with EMA 20 at $3.7139 and EMA 50 at $3.8488, confirming sellers currently have the upper hand on this timeframe.
Whether UNI reclaims the broken trendline and pushes back above these EMAs, or breaks down further from the current channel, will decide the next move.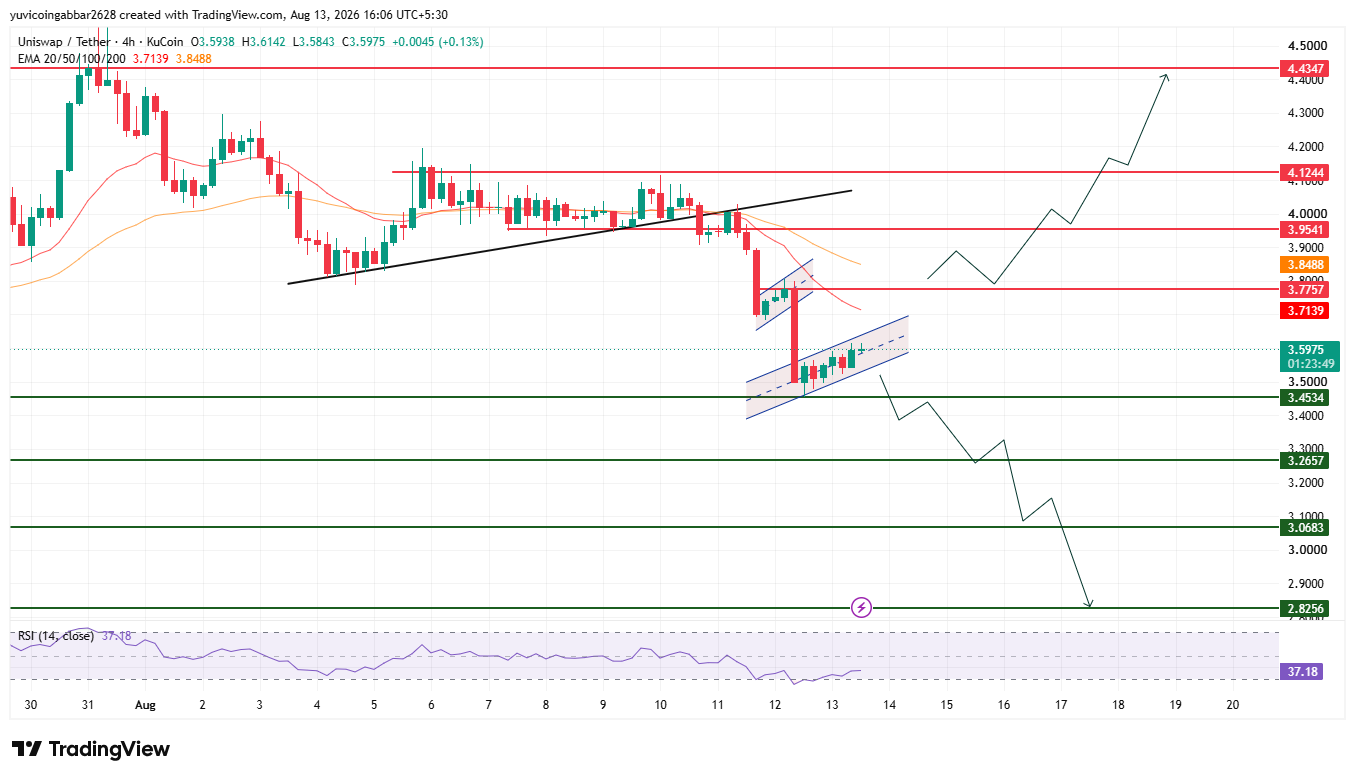
UNI Support and Resistance Levels
Level Type | Price |
Resistance 4 | $4.4347 |
Resistance 3 | $4.1244 |
Resistance 2 | $3.9541 |
Resistance 1 (nearest) | $3.7757 |
Current Price | $3.5975 |
First Support | $3.4534 |
Deeper Support 1 | $3.2657 |
Deeper Support 2 | $3.0683 |
Structural Floor | $2.8256 |
EMA Levels
EMA | Price |
EMA 20 | $3.7139 |
EMA 50 | $3.8488 |
UNI Price Scenarios: Triggers and Invalidation
Scenario | Trigger | Likely Outcome | Invalidation Point |
Trendline reclaim | Close above $3.7757 and above both EMAs | Move toward $3.9541, then $4.1244 and $4.4347 | Rejection back below $3.7757 |
Channel hold | Price stays between $3.4534 and $3.7757 | Choppy, range-bound trading | Break of either boundary |
Channel breakdown | Close below $3.4534 | Move toward $3.2657, then $3.0683 and $2.8256 | Reclaim of $3.4534 |
Uniswap Price Prediction: Bull Case vs Bear Case
$UNI price target 2026 Bull Case: If $UNI reclaims the broken trendline and closes back above $3.7757, clearing both the EMA 20 at $3.7139 and the EMA 50 at $3.8488, the upper levels to watch are $3.9541, $4.1244, and eventually $4.4347.
This would suggest the recent breakdown was a shakeout rather than a genuine trend change.
$UNI price target 2026 Bear Case: If $UNI breaks below the $3.4534 support instead, the price can move toward $3.2657 and $3.0683, with $2.8256 as the next major level below that.
Staying below both EMAs would confirm sellers remain in control and that the trendline break is more than a temporary dip.
$UNI price target: Can $UNI Reach $4.4347?
$4.4347 is the highest resistance level marked on the chart.
Reaching it would require $UNI to first reclaim the broken trendline near $3.7757, clear both EMAs, and then work through $3.9541 and $4.1244 before making a final run at $4.4347.
That's a multi-stage recovery, not a single move, and it depends on the trendline reclaim holding rather than fading.
What Could Invalidate the Bullish Setup?
A rejection at $3.7757, with $UNI failing to clear the EMA cluster near $3.7139 to $3.8488, followed by a close back below the $3.4534 support, would put the recovery case in doubt.
A deeper break through $3.2657 and $3.0683 toward the structural floor at $2.8256 would confirm the descending channel is continuing rather than reversing.
Uniswap Price Prediction: Expert View
According to CoinGabbar analysts, $UNI has broken down from an ascending trendline it had held for roughly two weeks, and the price is now testing support just above $3.4534 inside a fresh descending channel.
Both EMAs sitting well above the current price show sellers still have the near-term edge, and a real trend change needs a clean close back above the trendline with the price holding over both EMA lines.
The Blockworks dashboard news reinforces Uniswap's scale as the top DEX by volume and fees, but it hasn't shifted the short-term technical picture.
Until UNI reclaims $3.7757, the safer read is that the price stays range-bound to lower.
Disclaimer: This piece is for informational purposes only and isn't financial advice. The levels and scenarios above are based on technical chart analysis and publicly available data at the time of writing, and crypto markets can move sharply within hours, so past patterns don't guarantee future outcomes. It's worth doing independent research and considering your own risk tolerance before acting on any of the levels discussed here.
Also read:
2 days ago
Every day, thousands of people visit websites offering investment opportunities, cryptocurrency services, and digital financial products. Many of these platforms are legitimate, but others are created solely to deceive unsuspecting users. At first glance, a fraudulent website may appear professional, complete with customer reviews, support chat, and polished branding. The difference is often hidden beneath the sur face. One of the most effective ways to reduce risk is to slow down before taking action. Verify the website address carefully, research the company behind the platform, and avoid making decisions based solely on urgency or promises of unusually high returns. A few extra minutes spent checking details can prevent significant financial loss. At **CYBER VAULT GUARD**, we regularly educate individuals and businesses about cybersecurity risks, blockchain investigations, digital forensics, and online fraud awareness. Additional information about our professional services and educational resources can be found at Fraudulent platforms often rely on psychological pressure rather than technical sophistication. Victims may be told they have only a limited time to invest, claim a reward, or verify an account. Others are encouraged to ignore warning signs because "everyone else is making money." These tactics are designed to bypass careful thinking and create a sense of urgency. Another important habit is protecting personal information. Recovery phrases, authentication codes, passwords, and private keys should never be shared with anyone claiming they need them for verification or technical support. Legitimate organizations rarely request this type of sensitive information through unsolicited messages. If you believe you have interacted with a suspicious platform, avoid making further transactions until you have reviewed the situation carefully. Preserve emails, screenshots, wallet addresses, transaction IDs, and any communication related to the incident. Even small details may help establish a clearer timeline during a professional review cybervaultguard (mailto:cybervaultguard@mail.com)is ultimately about making informed decisions. Technology provides powerful tools, but good judgment remains one of the strongest forms of protection. Staying informed, verifying information independently, and approaching unexpected opportunities with caution can significantly reduce exposure to online fraud. For confidential inquiries regarding cybersecurity consulting, blockchain investigations, digital forensics, or incident response, you can contact our team at **[CYBER VAULT GUARD is committed to helping individuals and organizations strengthen their digital security through professional guidance, technical expertise, and evidence-based investigations. Mail at:(mailto:cybervaultguard@mail.com) Whats App: +4.4.7.4.0.1.7.7.1.4.5.5 Telegram https://t.me/CYBER_VAULT_GUARD

4 weeks ago
Protecting Your Crypto From SIM-Swap: Practical Steps Everyone Should Take META TECH RECOVERY PRO I recently had my email and SIM compromised, and it was extremely frightening. All day, my phone kept dropping its network connection. Unbeknownst to me, my mobile data, bank account, and crypto wallet were being targeted in real time. Within minutes, I was locked out of my email, my exchange accounts and my entire crypto portfolio had been drained. My accounts and crypto wallet were effectively wiped. I still cannot understand how these scammers operate—specifically, how they generate OTPs to gain access to victims’ accounts. In my desperation, I turned to META TECH RECOVERY PRO for help. Their support helped ensure that all data was recovered and that my crypto funds and wallet were restored quickly and smoothly, with NO UPFRONT FEE. CONTACT THEM VIA M e t a t e c h @ W r i t e m e . C o m T e l e g r a m : @ m e t a t e c h r e c o v e r y p r o t e a m. W/S + 1 4 6 9 6 9 2 8 0 4 9.
4 weeks ago
Protecting Your Crypto From SIM-Swap: Practical Steps Everyone Should Take META TECH RECOVERY PRO I recently had my email and SIM compromised, and it was extremely frightening. All day, my phone kept dropping its network connection. Unbeknownst to me, my mobile data, bank account, and crypto wallet were being targeted in real time. Within minutes, I was locked out of my email, my exchange accounts and my entire crypto portfolio had been drained. My accounts and crypto wallet were effectively wiped. I still cannot understand how these scammers operate—specifically, how they generate OTPs to gain access to victims’ accounts. In my desperation, I turned to META TECH RECOVERY PRO for help. Their support helped ensure that all data was recovered and that my crypto funds and wallet were restored quickly and smoothly, with NO UPFRONT FEE. CONTACT THEM VIA M e t a t e c h @ W r i t e m e . C o m T e l e g r a m : @ m e t a t e c h r e c o v e r y p r o t e a m. W/S + 1 4 6 9 6 9 2 8 0 4 9.
1 month ago
SAGITTARIUS CYPHER CYBER INTELLIGENCE is a global investigative firm specializing in cyber intelligence, blockchain forensics, crypto wallet and exchange tracing, and cryptocurrency intelligence. Focused on recovering stolen digital assets, their team combines advanced blockchain analytics, transaction graphing, and on-chain/off-chain correlation to locate and document the flow of funds. Using these methods, they can trace transfers across wallets and exchanges, identify laundering patterns, and uncover links to custodial services or cash-out points. Services include: - Blockchain transaction tracing: Mapping the movement of stolen coins through transaction graphs to pinpoint current wallet locations. - Exchange and wallet liaison: Coordinating with centralized exchanges and wallet providers to freeze assets or request account information where legal avenues permit. - Evidence collection and reporting: Producing court-ready forensic reports and chain-of-custody documentation to support legal recovery efforts. - Cross-border investigations: Leveraging international partnerships and legal channels to pursue assets moved across jurisdictions. - Preventive advice and containment: Recommending security improvements and rapid-response containment steps to limit further loss. Example outcomes: locating funds partially cashed out through mixers, identifying deposit addresses tied to illicit exchange accounts, and producing admissible forensic evidence that enabled asset freezes or restitution orders. If you have been targeted by a crypto or Bitcoin scam, SAGITTARIUS CYPHER CYBER INTELLIGENCE applies proven investigative techniques and global collaboration to maximize the chances of recovering your funds and documenting the case for legal action. For more inquiries: FOR HELP VIA info@sagittariuscyphercyberintelligence.com https://sagittariuscyphercyberintelligence.com WhatsApp +1 (226) 457‑3805 Telegram @sagittariuscyphercyber.

















