Uniswap Price Prediction: $UNI Crash Spark, Bigger Drop or Rally Next?


Uniswap just took a sharp hit, and traders are scrambling to figure out what comes next.
UNI broke down hard from levels near its recent highs, wiping out weeks of steady gains in a matter of days.
This Uniswap Price Prediction looks at whether this crash is the start of a deeper slide or just an overdone reaction that sets up a bounce.
With the price now sitting in oversold territory, the next move could go either way, and the coming days look important for anyone watching UNI right now.
Market data was checked on August 12, 2026, at 16:15 IST.
Uniswap Price Prediction Today: Market Overview
Metric | Value |
Price | $3.5180 |
24h Change | -10.58% |
Market Cap | $2.19B |
FDV | $3.14B |
24h Volume | $321M |
Vol/Mkt Cap (24h) | 14.45% |
TVL | $3.01B |
Market Cap/TVL | 0.7338 |
Total Supply | 891.49M $UNI |
Circulating Supply | 624.24M+ $UNI |
Source: Data from CoinMarketCap as of August 12, 2026, at 16:15 IST. Figures may vary slightly across other tracking websites.
Uniswap Price Prediction Chart: Technical Analysis
Pair: UNI/USDT · Market: Spot (Crypto) · Exchange: KuCoin · Timeframe: 4H · Source: TradingView · Timestamp: August 12, 2026, 16:15 UTC+5:30
UNI is trading at $3.5180, a sharp selloff that broke below the ascending trendline it had followed since early July.
Price also dropped below both EMAs during the crash, and the EMA 20 at $3.8330 and EMA 50 at $3.9252 now sit well above the current price, acting as resistance rather than support.
RSI (14) reads 26.90, firmly in oversold territory, suggesting the selloff has been aggressive enough that a short-term bounce wouldn't be surprising.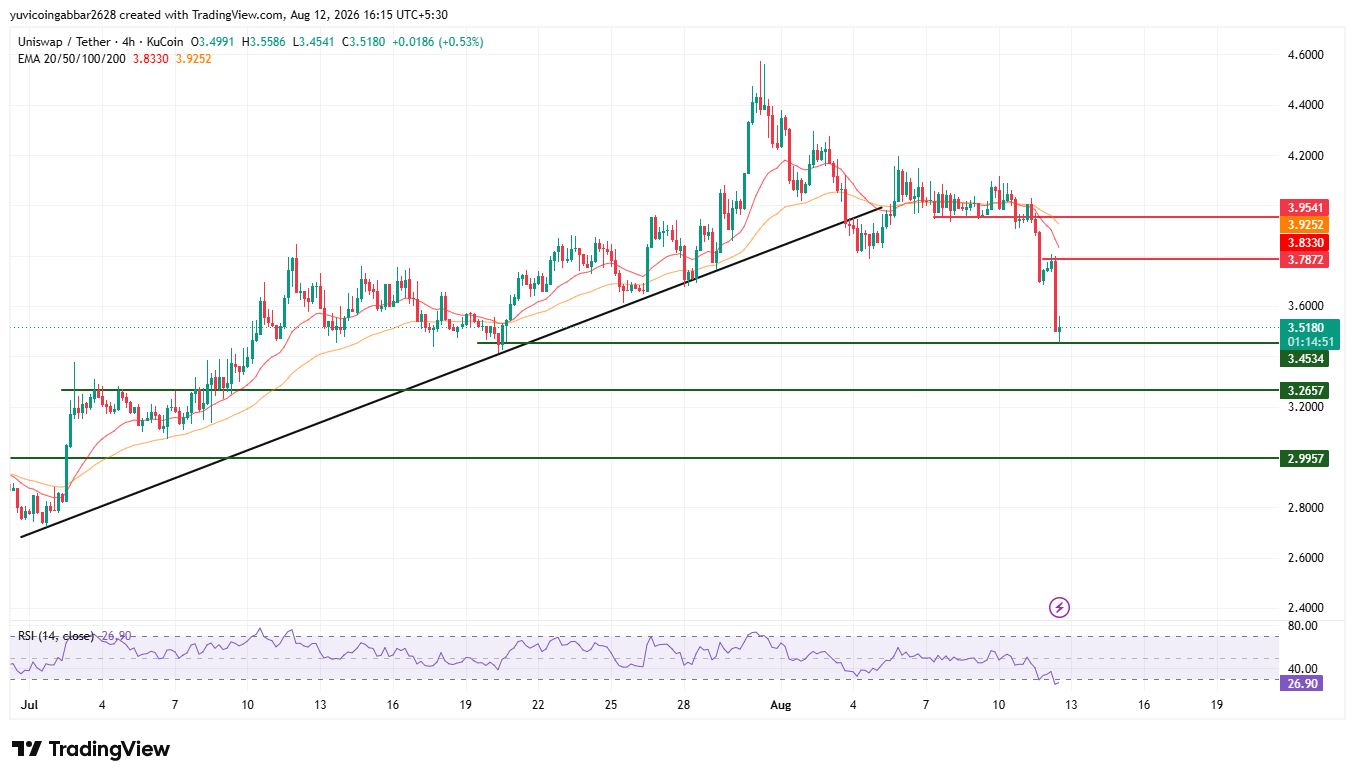
Support and Resistance Levels
Level Type | Price |
Resistance 2 | $3.9541 |
Resistance 1 (nearest) | $3.7872 |
Immediate Price Reference | $3.5180 |
First Support | $3.4534 |
Deeper Support | $3.2657 |
Structural Floor | $2.9957 |
EMA Levels
EMA | Price |
EMA 20 | $3.8330 |
EMA 50 | $3.9252 |
Uniswap Forecast
UNI price target 2026 Bull Case: If price holds above the first confirmed support at $3.4534 and starts reclaiming ground toward the EMA cluster near $3.8330 to $3.9252, we could see this crash turn into a base-building phase rather than the start of a deeper drop.
Oversold RSI at 26.90 raises the odds of a relief bounce even without new positive news.
UNI price target 2026 Bear Case: If the price breaks below $3.4534, it could fall further toward $3.2657 and eventually the structural floor at $2.9957.
A confirmed loss of the trendline zone with no signs of buyers stepping in would suggest the crash still has room to run.
UNI Price Target: Can UNI Reach $3.9541?
$3.9541 is the highest resistance level marked on the chart.
Reaching it would require UNI to first reclaim the first confirmed support at $3.4534 as a base, then clear the EMA cluster near $3.8330 to $3.9252, and finally push through the nearest resistance at $3.7872, a multi-stage recovery that looks unlikely while the trendline breakdown is still fresh.
What Could Invalidate the Bullish Setup?
A failure to hold $3.4534, followed by a close below it, would suggest the selloff is continuing rather than stabilizing.
A deeper break below $3.2657 and the structural floor at $2.9957 would confirm the crash has further downside left, regardless of how oversold RSI currently looks.
Uniswap Price Prediction: Expert View
According to CoinGabbar analysts, UNI's sharp break below its trendline and both EMAs point to a genuine shift in short-term sentiment, not just a minor pullback.
RSI at 26.90 shows the move has been steep enough that some kind of bounce is likely, even if the broader trend stays bearish for now.
The $3.4534 support level is the key line in the sand: holding it would open the door to a relief rally back toward the EMA cluster, while losing it would confirm sellers are still firmly in control.
Disclaimer: This piece is for informational purposes only and isn't financial advice. The levels and scenarios above are based on technical chart analysis and publicly available data at the time of writing, and crypto markets can move sharply within hours, so past patterns don't guarantee future outcomes. It's worth doing independent research and considering your own risk tolerance before acting on any of the levels discussed here.

















