Shiba Inu Price Prediction: $SHIB $500M Buyback, Eyes All-Time High?


A rumor claiming SHIB's founders are planning a $500 million buyback this week is spreading fast, and that's exactly the kind of headline that gets a meme coin trending again.
Shiba Inu is a dog-themed meme coin that has grown into a wider ecosystem, including Shibarium, its own Layer 2 network.
This Shiba Inu Price Prediction looks at whether the buyback talk and a fresh Shibarium activity spike can offset a chart that's still stuck below its EMA lines.
Market data was checked on August 18, 2026, at 12:22 IST.
Shiba Inu Price Prediction Today: Market Overview
Metric | Value |
Price | $0.000004407 |
1D Change (chart) | -1.45% |
Market Cap | $2.59B |
Unlocked Market Cap | $2.59B |
FDV | $2.59B |
24h Volume | $56.0M+ |
Vol/Mkt Cap (24h) | 2.15% |
Liquidity/Mkt Cap | 0.15% |
Total Supply | 589.49T SHIB |
Max Supply | 589.55T $SHIB |
Circulating Supply | 589.23T $SHIB |
Holders | 3.07M |
Source: Data from CoinMarketCap as of August 18, 2026, at 12:22 IST. Figures may vary slightly across other tracking websites.
SHIB Crypto News: $500M Buyback Rumor
A post from crypto account Steph Is Crypto claims SHIB's founders are reportedly planning a massive $500 million buyback this week.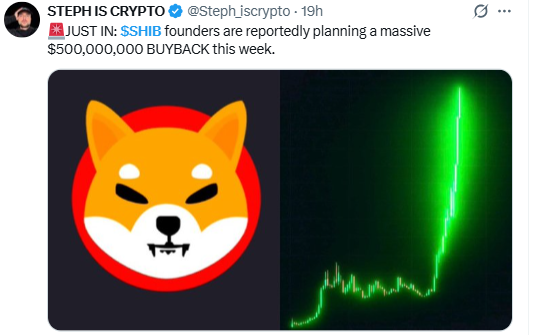
Source: Data From X
Note: This hasn't come from Shiba Inu's official channels, so CoinGabbar could not independently verify it, and it should be treated as an unconfirmed rumor rather than confirmed news until an official source weighs in.
SHIB News: Shibarium's TVL Surge
A post from BSCNews points to genuine on-chain growth. SHIB is still far below its 2021 highs, but it's up 7.0% over the past month, trading near $0.00000443 at the time of that post.
The more notable move is on Shibarium, SHIB's Layer 2 network: on-chain fees rose 79.5% over the past month to $22.10, and total value locked spiked 298% over 30 days, 287% of that in just the last week, taking Shibarium's TVL to $97,453.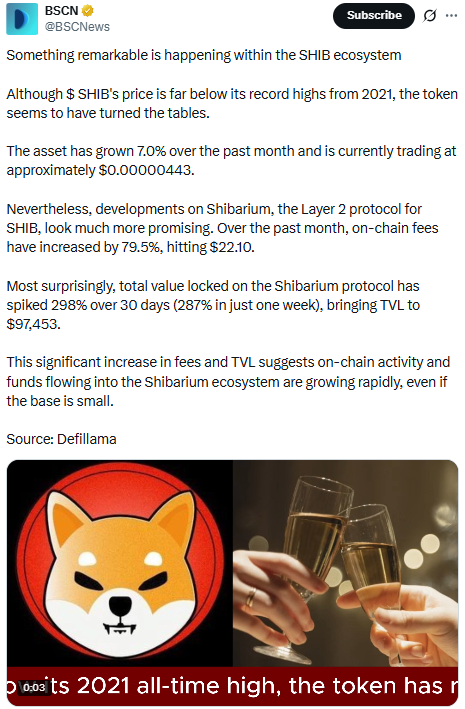
The figures are sourced to DefiLlama and suggest real, if still small-scale, activity flowing into the Shibarium ecosystem even while SHIB's own price has been drifting lower.
SHIB Price Prediction Chart: Technical Analysis
Pair: SHIB/USDT · Market: Spot · Exchange: KuCoin · Timeframe: 1D · Source: TradingView · Timestamp: August 18, 2026, 12:22 UTC+5:30
SHIB is trading at $0.000004407, after breaking below a descending channel that had contained the pullback since the late-July spike.
Price is now consolidating just under that channel, sitting below both EMA lines. RSI (Relative Strength Index) reads 43.67, below the neutral 50 mark, showing momentum leaning bearish but not yet oversold.
The EMA (Exponential Moving Average) cluster sits just above the current price, with the 20 EMA at $0.000004552 and the 50 EMA at $0.000004605, both acting as resistance.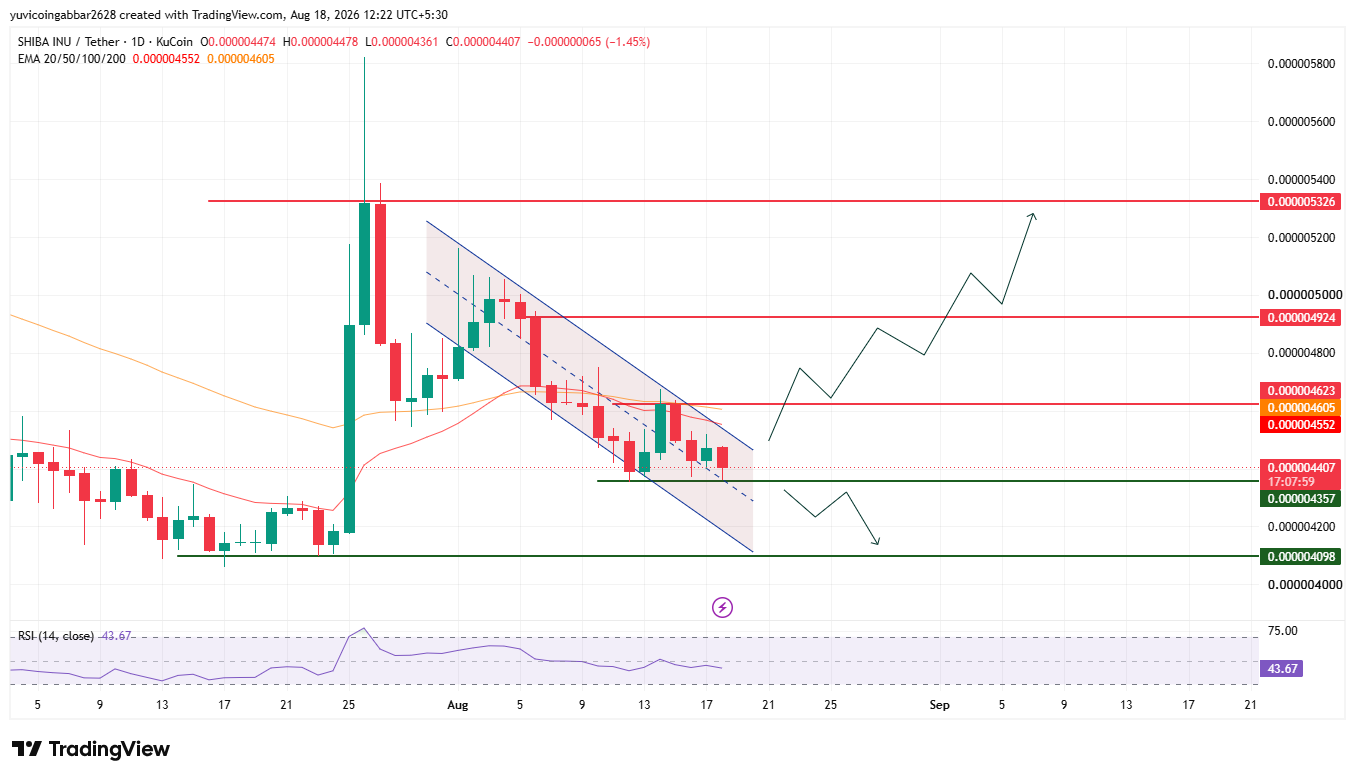
Support and Resistance Levels
Level Type | Price |
Resistance 3 | $0.000005326 |
Resistance 2 | $0.000004924 |
Resistance 1 (nearest) | $0.000004623 |
Immediate Price Reference | $0.000004407 |
First Support | $0.000004357 |
Deeper Support | $0.000004098 |
EMA Levels
EMA | Price |
EMA (20) | $0.000004552 |
EMA (50) | $0.000004605 |
Shiba Inu Forecast: Bull Case vs. Bear Case
SHIB price target 2026 Bull case: Holding above the first confirmed support at $0.000004357 and reclaiming the EMA cluster near $0.000004552 to $0.000004605 would suggest the channel breakdown is stabilizing.
If the buyback rumor gets confirmed, it could accelerate a move through the nearest resistance at $0.000004623 toward $0.000004924 and $0.000005326.
SHIB price target 2026 Bear case: A break below $0.000004357 would confirm sellers remain in control and put the current consolidation at risk.
Losing $0.000004098 would mark a deeper slide, and if the buyback rumor turns out to be false, any short-term bounce built on it could unwind quickly.
Price Scenarios: Triggers and Invalidation
Scenario | Trigger | Likely Outcome | Invalidation Point |
EMA reclaim | Close above $0.000004605 | The path opens toward $0.000004924 and $0.000005326 | Rejection back below $0.000004552 |
Support zone hold | Price stays above $0.000004357 | Consolidation continues near current levels. | Close below $0.000004357 |
Support zone breakdown | Close below $0.000004357 | Drop toward $0.000004098 | Reclaim of $0.000004357 |
SHIB Price Target: Can SHIB Reach $0.000005326?
$0.000005326 is the highest resistance level marked on the chart.
Reaching it would require SHIB to first reclaim the EMA cluster near $0.000004552 to $0.000004605, clear the nearest resistance at $0.000004623, then break and hold above $0.000004924.
A multi-stage move that would likely need a real catalyst, such as confirmation of the buyback rumor, rather than chart momentum alone.
What Could Invalidate the Bullish Setup?
A rejection at the EMA cluster near $0.000004552 to $0.000004605 followed by a close back below the first confirmed support at $0.000004357 would put any recovery in question.
A deeper break below $0.000004098 would undermine the setup entirely, especially if the buyback rumor fails to materialize and sentiment fades.
Shiba Inu Price Prediction: Expert View
According to CoinGabbar analysts, SHIB's chart still shows sellers in control, with the price sitting below both EMA lines and RSI at 43.67, leaning bearish rather than neutral.
What makes this setup worth watching is the mismatch between price and fundamentals: Shibarium's TVL and fee growth over the past month point to real user activity building underneath a token that's been drifting lower.
The $500 million buyback rumor adds a wildcard, since unconfirmed news like this can move the price fast in either direction once it's confirmed or denied.
Until then, the $0.000004357 to $0.000004623 zone remains the level to watch; holding it keeps the setup neutral to constructive, while losing it favors the sellers.
Disclaimer: This piece is for informational purposes only and isn't financial advice. The levels and scenarios above are based on technical chart analysis and publicly available data at the time of writing, and crypto markets can move sharply within hours, so past patterns don't guarantee future outcomes. It's worth doing independent research and considering your own risk tolerance before acting on any of the levels discussed here.
Also read:







.webp)








