Virtuals Protocol Price Prediction: Can VIRTUAL Really Hit $1?


Virtuals Protocol ($VIRTUAL) is trading at $0.737, up 8.06% in the last 24 hours, according to CoinGlass.
This Virtuals Protocol price prediction 2026 update and the broader VIRTUAL price prediction September 2026 outlook come as the token pushes against the upper trendline of a descending channel it has been trading inside since late August, keeping traders watching this Virtuals Protocol coin price prediction closely for a potential breakout.
Why Is Virtuals Protocol (VIRTUAL) Rallying Today?
$VIRTUAL's market cap now stands at $487.11 million on a circulating supply of 658.98 million out of a fixed 1.00 billion total supply, per Etherscan.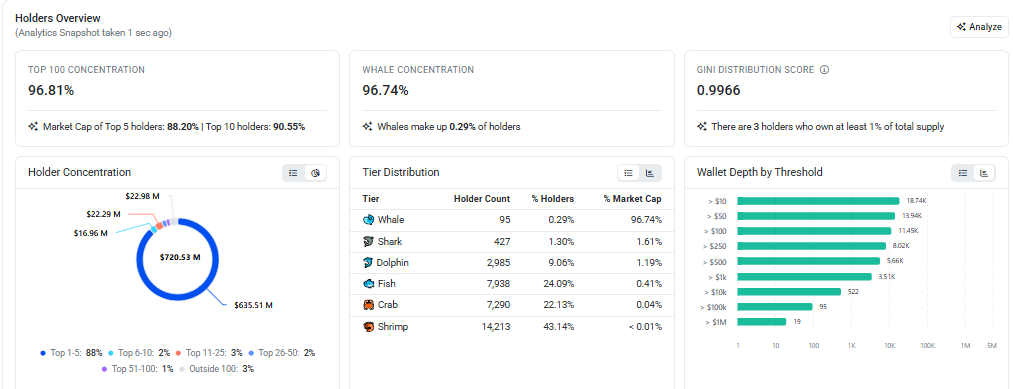
On-chain holder data shows fairly concentrated ownership: the top 100 wallets hold 96.81% of supply, and the top 5 holders alone account for 88.20% of market cap, with a Gini distribution score of 0.9966.
Whale wallets make up just 0.29% of holders but control 96.74% of market cap, while shrimp-tier wallets (over 14,213 of them) make up 43.14% of holders but under 0.01% of market cap.
This Virtuals Protocol crypto price prediction setup means large-wallet activity can meaningfully swing the price in either direction.
Virtuals Protocol Derivatives Data
A closer $VIRTUAL open interest analysis shows open interest has climbed to $96.74 million, with the OI chart showing $96.37M at the last update as $VIRTUAL traded near $0.73, according to CoinGlass.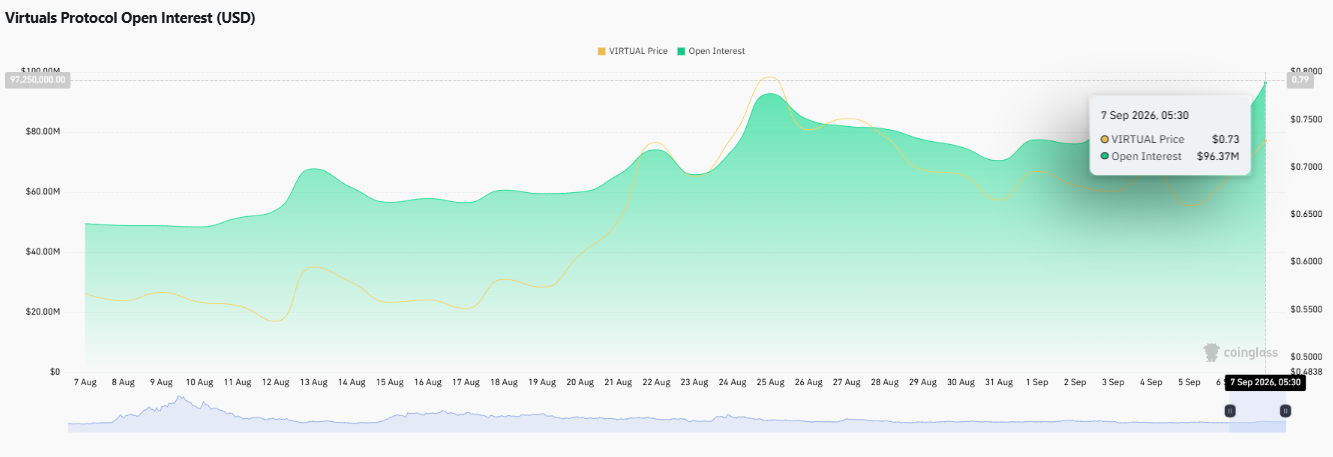
Futures volume over 24 hours came in strong at $152.34 million against spot volume of $34.49 million, showing futures desks are driving most of the price action.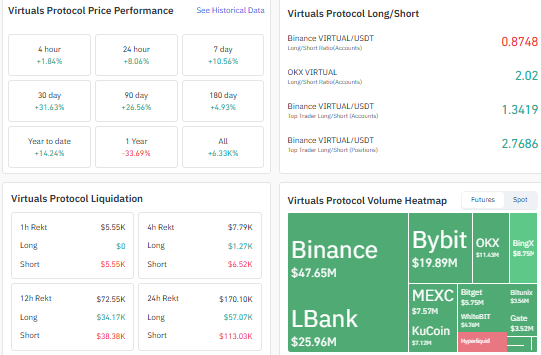
A Virtuals Protocol long short ratio analysis shows a mixed positioning picture: Binance's retail long/short ratio sits at 0.8748 (short-tilted), while OKX shows 2.02 (long-tilted), and Binance's top trader accounts and positions ratios read 1.3419 and 2.7686, respectively, both leaning long.
A VIRTUAL liquidation data analysis for the past 24 hours shows $113.03K in short liquidations versus $57.07K in long liquidations, suggesting shorts have been getting squeezed as price pushed higher.
Virtuals Protocol Price Performance
VIRTUAL's price performance shows strong recent momentum: up 1.84% over 4 hours, 8.06% over 24 hours, and 10.56% over 7 days.
The 30-day return stands at +31.63%, the 90-day return at +26.56%, and the 180-day return at +4.93%.
Year-to-date, $VIRTUAL is up 14.24%, though the 1-year figure remains negative at -33.69%. The all-time performance figure is positive at +6.33%.
Virtuals Protocol (VIRTUAL) Technical Analysis
On the 4-hour TradingView chart, VIRTUAL token has been trading inside a descending channel since late August, and it is now testing the upper trendline of that channel. 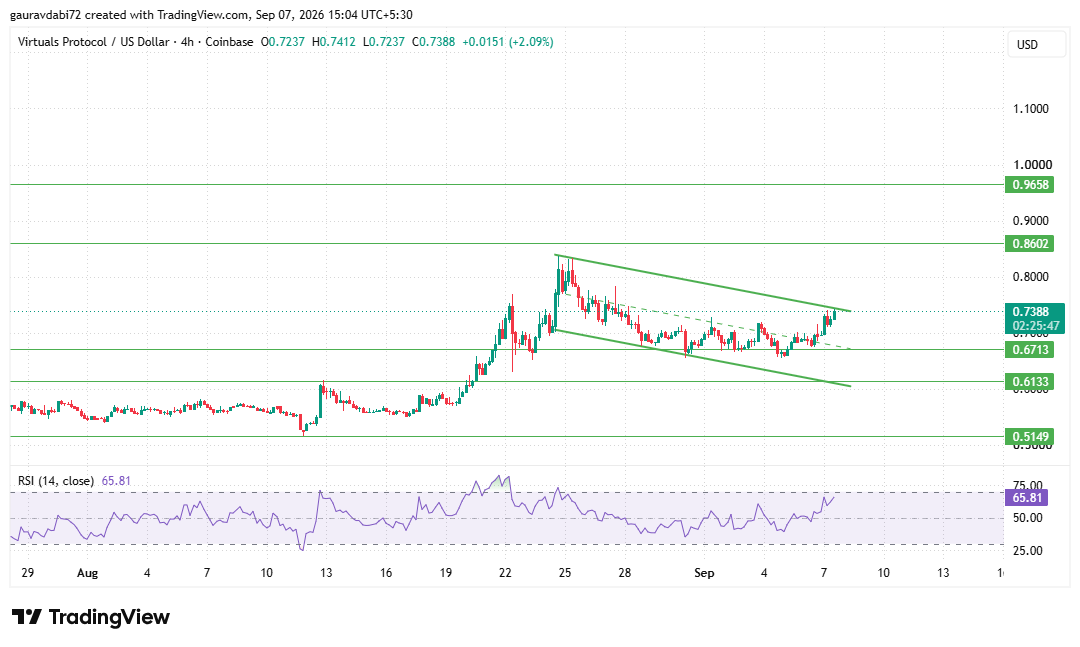
If VIRTUAL can break above this trendline and hold the move, it could set up a strong upmove toward higher resistance levels.
Near-term support levels sit at $0.6713, $0.6133, and $0.5149, while resistance is placed at $0.8602 and $0.9658.
The 14-period RSI reads 65.81, which is elevated but still below overbought territory, leaving room for further upside before momentum becomes stretched.
The short-liquidation-heavy 24-hour, long-leaning top trader positioning and a healthy (not overbought) RSI support the case for a breakout continuation if the channel resistance is cleared and held.
Virtuals Protocol Price Prediction 2026
For this $VIRTUAL price prediction, if the token breaks and holds above the descending channel's upper trendline, it could move toward the $0.8602 resistance level, with a further push potentially opening the path to $0.9658.
This VIRTUAL token forecast would strengthen further on sustained volume and continued short liquidations.
On the downside, if VIRTUAL fails to hold the breakout, a pullback toward $0.6713 is likely, with $0.6133 and $0.5149 as deeper support levels if selling pressure returns.
Expert Take
As per the CoinGabbar analyst, the combination of rising open interest, short-heavy liquidations, and long-leaning top trader positioning on Binance suggests larger players are positioning for upside, even as retail sentiment on Binance skews short.
A clean break and hold above the descending channel would likely confirm this bullish bias, while a failure to clear resistance could see VIRTUAL slip back into range-bound trading between $0.6713 and $0.8602.
Conclusion
Virtuals Protocol is testing a key breakout point after weeks inside a descending channel, backed by rising open interest and a short-liquidation-heavy derivatives market.
A confirmed breakout keeps $0.8602 and $0.9658 in play, while $0.6713, $0.6133, and $0.5149 remain the key support levels to watch on any rejection.
Disclaimer: This article is for informational purposes only and does not constitute financial advice. Cryptocurrency markets are highly volatile; conduct your own research before making any investment decisions.
Also read:

















