Worldcoin Price Prediction: WLD Just Gave Bulls a New Opening


$WLD spent much of the summer sliding lower inside a well-defined descending channel, and for weeks that trend looked firmly in control.
That's starting to change. Price has now pushed above the channel's upper boundary, and traders are asking whether this is the start of a real reversal or another rejection waiting to happen.
This Worldcoin Price Prediction breaks down the chart structure, derivatives positioning, and the levels that will decide which way this goes.
Where Does WLD Stand Right Now?
$WLD is trading at $0.3600, up 4.38% over the last 24 hours. Market cap sits at $1.29B, up 4.42%, while 24-hour volume has jumped 64.75% to $198.47M.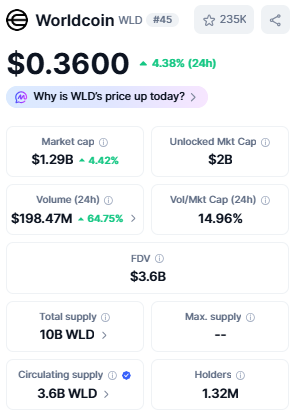
alongside the move. The token carries a $3.6B fully diluted valuation against 3.6B WLD in circulating supply out of a 10B total supply, with no fixed max supply, and a holder base of 1.32M.
Data source: CoinMarketCap
What Are Futures Traders Signalling?
Futures volume is led by Binance at $134.67M, followed by OKX ($86.53M), MEXC ($65.37M), Bybit ($36.68M), and WhiteBIT ($24.74M), with Gate, BingX, Bitunix, Bitget, Hyperliquid, and KuCoin making up the rest.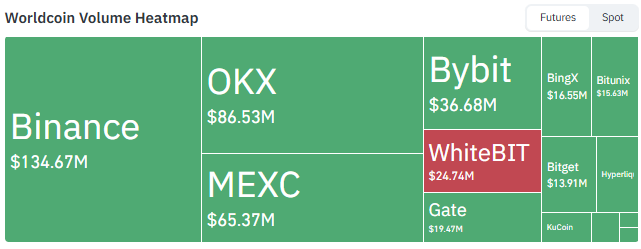
Open interest has remained elevated after reaching its mid-June peak near $580M. It later cooled as WLD moved lower, but the latest data shows derivatives positioning is still significant.
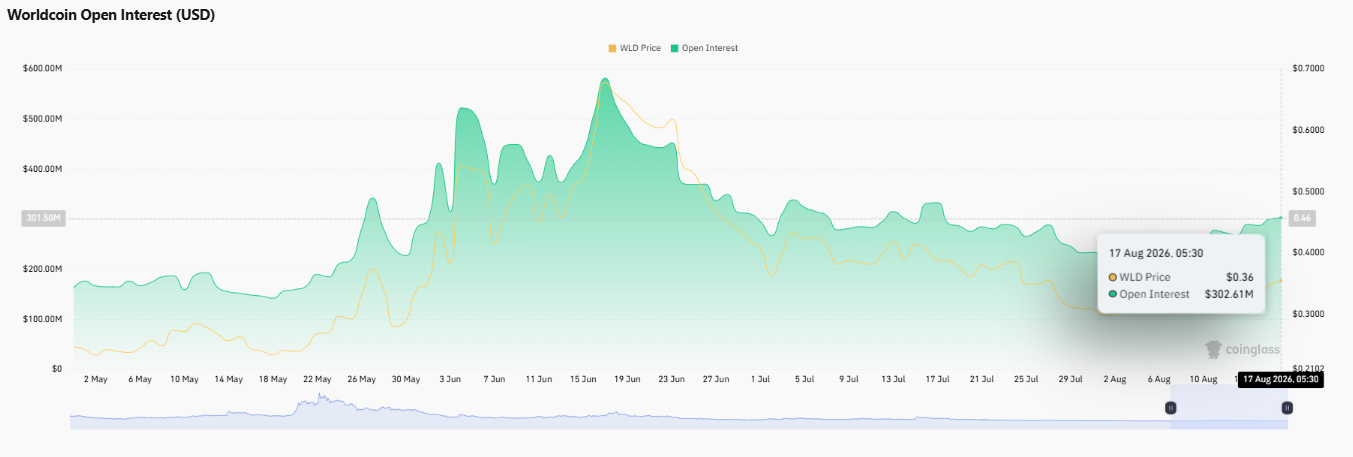
WLD was trading near $0.36, while open interest stood at around $302.61M. With price now breaking above the descending channel, the key question is whether rising participation will support the breakout or add volatility if the move fails.
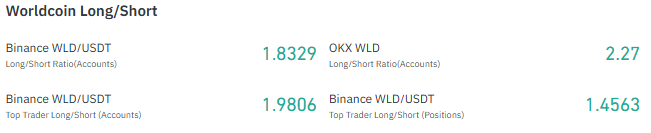
Positioning is heavily long-skewed across the board. Binance's account-based long/short ratio stands at 1.8329, and OKX runs even higher at 2.27. Binance's top trader accounts show a 1.9806 ratio, while the position-weighted long/short ratio for top traders comes in lower at 1.4563, suggesting some of that long conviction is more spread across smaller accounts than concentrated in size.
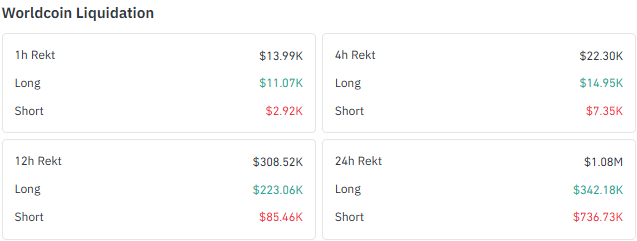
Liquidations tell a notably different story over the past day. Total 24-hour liquidations reached $1.08M, with $736.73K coming from short positions against $342.18K in longs, pointing to a squeeze on shorts as the price broke above the channel.
The shorter windows show a mixed picture, with the 1h and 4h Rekt totals skewed toward longs instead, hinting at some early profit-taking or pullback pressure within the move itself.
Data source: CoinGlass
Technical Analysis: WLD Breaks the Descending Channel
$WLD had been trading inside a descending channel since July, with sellers controlling most rebounds.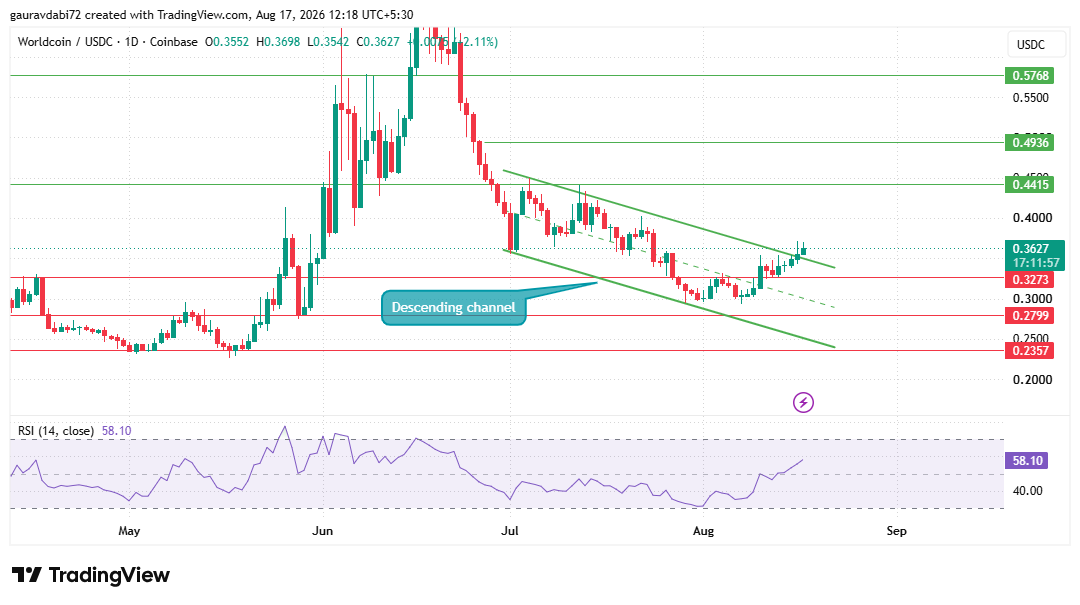
The recent move above the upper boundary has now challenged that structure.
The breakout still needs confirmation. A daily close above the channel, followed by sustained buying, would strengthen the reversal case.
If buyers hold the breakout, $0.4415 is the first resistance, followed by $0.4936 and $0.5768.
A failed breakout would put WLD back inside the channel and shift attention to $0.3273, then $0.2799 and $0.2357.
RSI at 58.10 shows improving momentum without overbought conditions. For now, RSI supports the move, but the real signal is whether WLD can hold above the broken channel.
Data source: TradingView
Worldcoin Price Prediction: Bull, Neutral and Bear Scenarios
Bullish Case | A daily close above the descending channel, followed by continued buyer support, keeps $0.4415 as the first level in view, with $0.4936 and $0.5768 further out if momentum holds. |
Neutral Case | $WLD chops around the broken channel boundary while the market waits for a decisive daily close, with RSI holding in the mid-50s without pushing to an extreme. |
Bearish Case | A slide back inside the descending channel turns the breakout into a false move, putting $0.3273 in focus first, with $0.2799 and $0.2357 as deeper supports if selling pressure builds. |
How Has $WLD Performed Recently?
$WLD is down 2.17% over the past 4 hours but still up 4.32% over 24 hours and 15.12% over the past week.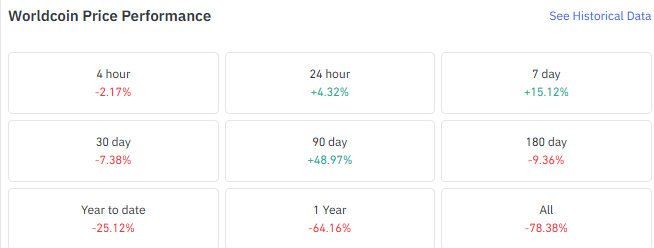
The 30-day window shows a 7.38% decline, even as the 90-day figure remains strongly positive at 48.97%.
Over six months $WLD is down 9.36%, and the broader downtrend is clear further out, with the token down 25.12% year to date, 64.16% over the past year, and 78.38% since inception.
Data source: CoinGlass
What We're Watching Next
As per the CoinGabbar analyst, the break above the descending channel is the most important development on WLD's chart in weeks, but the structure alone won't settle the question.
What happens on the next daily close, and whether buyers keep defending the breakout afterward, will do more to shape the outlook than any single level. Given how sharp the prior downtrend was, a period of back-and-forth around this zone would not be unusual before the market commits to a direction.
Disclaimer: This article is for informational purposes only and should not be considered financial or investment advice. Cryptocurrency markets are highly volatile, and prices can move sharply in either direction. Readers should conduct their own research and consult a qualified financial advisor before making any investment decisions.
Also read:













.webp)








