Worldcoin Price Prediction: $WLD Breaks Trendline, Bulls Target $0.38?


Worldcoin is exploding back into the conversation, and traders don't want to miss this window.
Backed by Sam Altman and built around World ID, its proof-of-personhood system for verifying real humans online, Worldcoin has quietly built one of crypto's boldest identity networks.
With a major World Chain upgrade landing in days and momentum building fast, this Worldcoin price prediction digs into whether the current setup is the start of the next big run or a trap before the flush.
Market data checked on August 10, 2026, at 09:38 IST.
Worldcoin Price Prediction Today: Market Overview
Metric | Value |
Price | $0.32595 |
24h Change | +6% |
Market Cap | $1.16B |
Unlocked Market Cap | $1.8B |
FDV | $3.25B |
24h Volume | $138.8M |
Vol/Mkt Cap (24h) | 11.78% |
Total Supply | 10B WLD |
Circulating Supply | 3.58B+ WLD |
Holders | 1.32M |
Source: Data from CoinMarketCap as of August 10, 2026, at 09:38 IST. Figures may vary slightly across other tracking websites.
WLD Network Update: World Chain Activate EIP-7928 on August 17
According to a post from Blockchain Daily News, World Chain (Worldcoin's Layer-2) is activating EIP-7928 on August 17, ahead of Ethereum's own rollout of the same upgrade, and this has since been corroborated by outlets including The Block and Bitcoin.com. 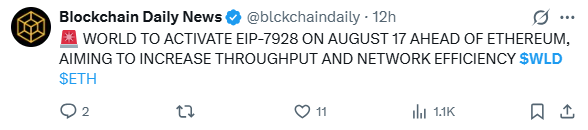
The upgrade streams block-level access lists, letting validators verify transactions in parallel instead of one at a time, aiming to boost throughput without raising validator hardware costs.
It's a network-scalability development, not a direct price catalyst, but it's the kind of fundamental backdrop that can support demand for WLD over time.
Worldcoin Derivatives Snapshot: Liquidation and Volume Data
This section uses Coinglass futures data, kept separate from the CoinGecko/CoinMarketCap spot volume referenced in the Market Overview table above.
WLD Token Forecast Liquidations
Window | Total Rekt | Long Liquidations | Short Liquidations |
1h | $1.93K | $382.40 | $1.55K |
4h | $63.71K | $1.76K | $61.96K |
12h | $189.84K | $104.35K | $85.49K |
24h | $553.00K | $199.27K | $353.73K |
Short liquidations have dominated across every window except the trailing hour, which lines up with the sharp upside candle that pushed price back through the EMA cluster; shorts positioned against the reclaim have been squeezed out, while long liquidations have stayed comparatively contained.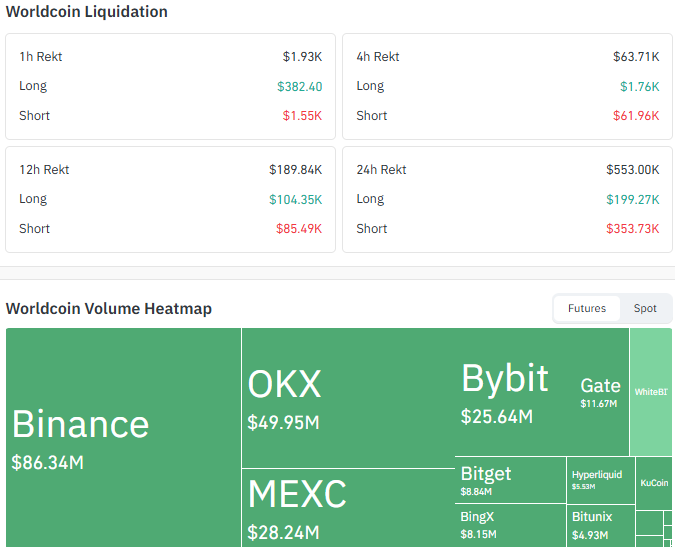
Source: Data From CoinGlass
WLD Token Forecast Futures Exchange Volume (24h)
Exchange | Volume |
Binance | $86.34M |
OKX | $49.95M |
Bybit | $25.64M |
MEXC | $28.24M |
Gate | $11.67M |
Binance and OKX together account for the bulk of visible futures activity, so those two order books are the most relevant for tracking near-term positioning shifts.
$WLD Price Prediction Chart: Technical Analysis
Pair: WLD/USD · Market: Spot (Crypto) · Exchange: Aggregated TradingView crypto feed (no single exchange specified on the chart) · Timeframe: 4H · Source: TradingView · Timestamp: August 10, 2026, 09:38 UTC+5:30
WLD is trading at $0.32595 after breaking a descending trendline that had raised the price since the late-July highs.
The move produced a sharp green candle that pushed price back above both its 20-period and 50-period EMAs, which are now sitting in a tight cluster just below the current price and flagged on the chart as a Bullish EMA Crossover.
RSI (14, close) reads 62.70, comfortably above the midline without being overbought, which leaves room for further upside before momentum becomes stretched.
Price is now consolidating just under the nearest resistance, 0.33127, level, with the trendline reclaim and EMA cluster acting as the immediate support zone to hold.
If the price breaks and holds above the resistance at $0.33127, we can expect to see the upper levels. If it breaks below the support at $0.31206, the lower levels to watch are. 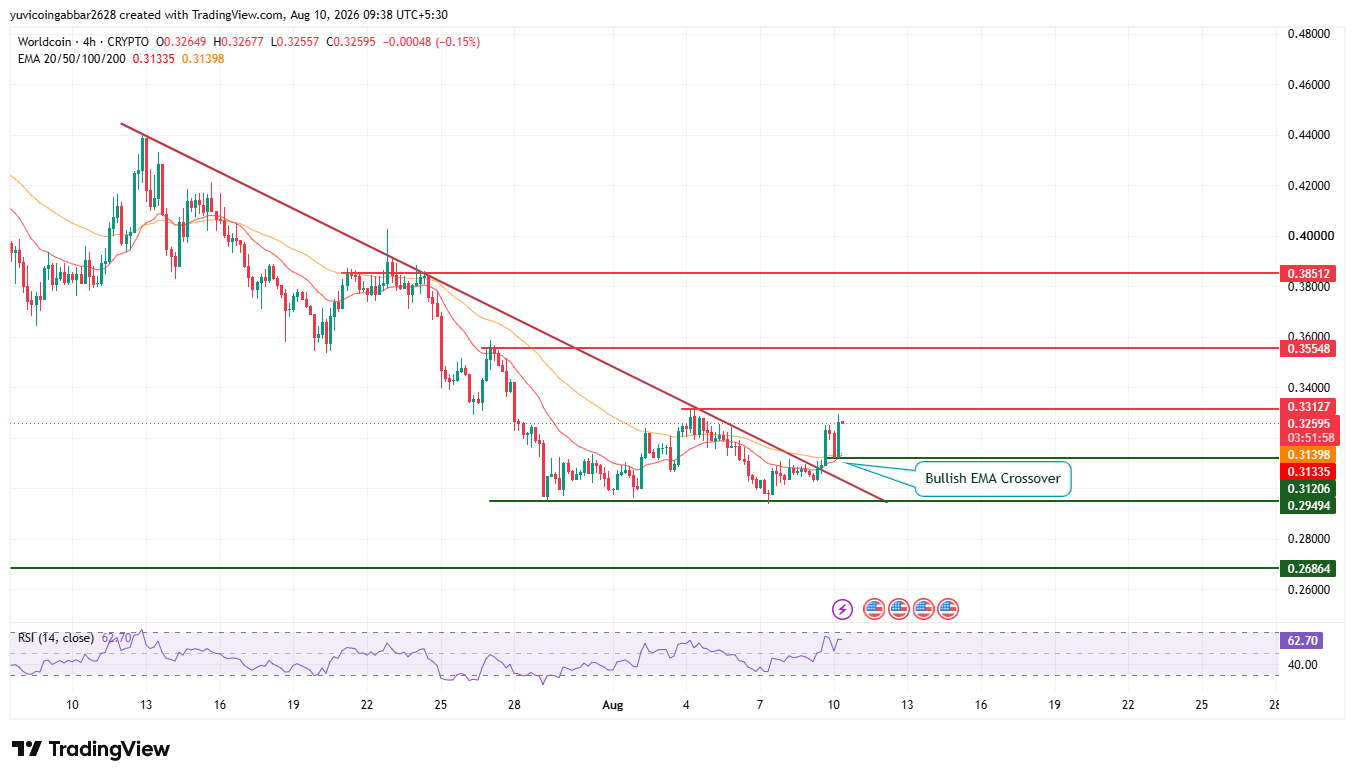
WLD Price Analysis: Support and Resistance Levels
Level Type | Price |
Resistance 3 | $0.38512 |
Resistance 2 | $0.35548 |
Resistance 1 (nearest) | $0.33127 |
Immediate Price Reference | $0.32595 |
First Support (trendline zone) | $0.31206 |
Deeper Support | $0.29494 |
Structural Floor | $0.26864 |
WLD Price Analysis: EMA Levels
EMA | Price |
EMA 20 | $0.31335 |
EMA 50 | $0.31398 |
Worldcoin Forecast: Bull Case vs. Bear Case
WLD price target 2026 Bull case: Holding above the trendline zone at $0.31206 and the EMA cluster near $0.31335 to $0.31398 keeps the reclaim intact.
A confirmed close above the nearest resistance at $0.33127 would open the path toward $0.35548 and eventually $0.38512, especially if the EIP-7928 rollout on August 17 draws fresh attention to the network.
WLD price target 2026 Bear case: A break back below the trendline zone at $0.31206 would put the reclaim in doubt and suggest the bounce was a short-covering spike rather than a genuine trend change.
Losing $0.29494 would expose the structural floor at $0.26864 as the next downside level.
WLD Price Target: Can WLD reach $0.38512?
$0.38512 is the highest resistance level marked on the chart. Reaching it would require WLD to first clear the EMA cluster near $0.31335 to $0.31398 and the nearest resistance at $0.33127, then break and hold above $0.35548, a multi-stage move rather than a single leg higher.
What Could Invalidate the Bullish WLD Setup?
A rejection at the nearest resistance near $0.33127 followed by a close back below the trendline zone at $0.31206 would put the reclaim in question.
A deeper break below $0.29494 and the structural floor at $0.26864 would undermine the recovery structure entirely, regardless of the EIP-7928 news backdrop.
Worldcoin Price Prediction 2026: Expert View
According to CoinGabbar analysts, the trendline reclaim, bullish EMA crossover, and RSI at 62.70 point to short-term momentum shifting back to buyers after the late-July pullback.
Heavy short liquidations across the 4h, 12h, and 24h windows back this up, suggesting the bounce squeezed out leveraged shorts rather than being driven by fresh long positioning.
The confirmed August 17 EIP-7928 activation on World Chain adds a fundamental tailwind, though it's a scalability story, not a direct demand driver. The $0.31206 to $0.33127 zone is the key battleground.
Worldcoin Price Prediction Data Sources
Price, EMA, and RSI data referenced from a 4H WLD/USD chart via TradingView, timestamped August 10, 2026, 09:38 UTC+5:30.
Market cap, FDV, volume, and supply data referenced from a CoinMarketCap tracker snapshot.
Liquidation and futures exchange volume data referenced from Coinglass. EIP-7928 activation details referenced from a Blockchain Daily News post on X, corroborated by The Block, Bitcoin.com, and AltcoinBuzz.
Disclaimer
This piece is for informational purposes only and isn't financial advice. The levels and scenarios above are based on technical chart analysis and publicly available data at the time of writing, and crypto markets can move sharply within hours, so past patterns don't guarantee future outcomes. It's worth doing independent research and considering your own risk tolerance before acting on any of the levels discussed here.

















