XRP Solana Price Analysis: Why Both Altcoins Lag as Market Rises


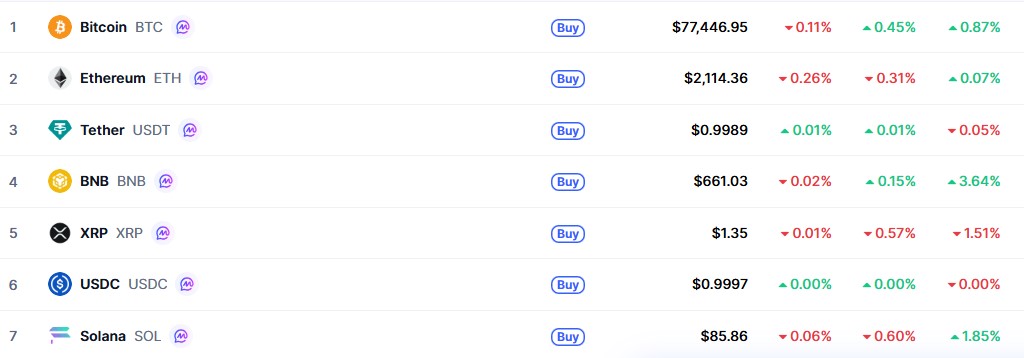
XRP Solana price analysis is becoming increasingly important as the broader crypto market climbs while two major altcoins struggle to gain momentum.
Bitcoin is holding firm, yet XRP and Solana remain trapped near key technical levels, leaving traders asking why both assets are lagging.
Today's XRP analysis points to a mix of derivatives positioning, options activity, ETF flows, and technical resistance.
Meanwhile, Solana is showing a different setup, with the price hovering near a long-term accumulation zone.
This article examines the latest XRP forecast, SOL structure, capital rotation, trading volume, and key levels that could determine where both assets move next.
Readers can also explore our detailed XRP price prediction 2026 for a broader long-term outlook.
XRP Price Analysis Today: Can Buyers Defend Key Support?
XRP is currently trading around $1.36, down 0.44% in the last 24 hours. The market cap sits at $84.09 billion with a circulating supply of 61.85 billion tokens. Spot volume over the past day came in at $358.88 million, which is moderate at best.
The derivatives side is telling a more interesting story. Futures volume in 24 hours reached $2.42 billion, up 2.35%. Open interest stands at $2.87 billion, up a small 0.43%.
The number that really stands out is options volume, which spiked 177.49% to $2.51 million. That kind of jump in options activity usually means traders are bracing for a bigger move in one direction or the other.
The Long/Short ratio across accounts on major exchanges sits at 0.8854, which means shorts are slightly winning the count right now. That is one reason the price is dragging.
On Binance specifically, the XRP/USDT account ratio is 2.74 in favor of longs, but the top trader position ratio sits at 1.78, showing even the big players are not fully committed to the upside yet.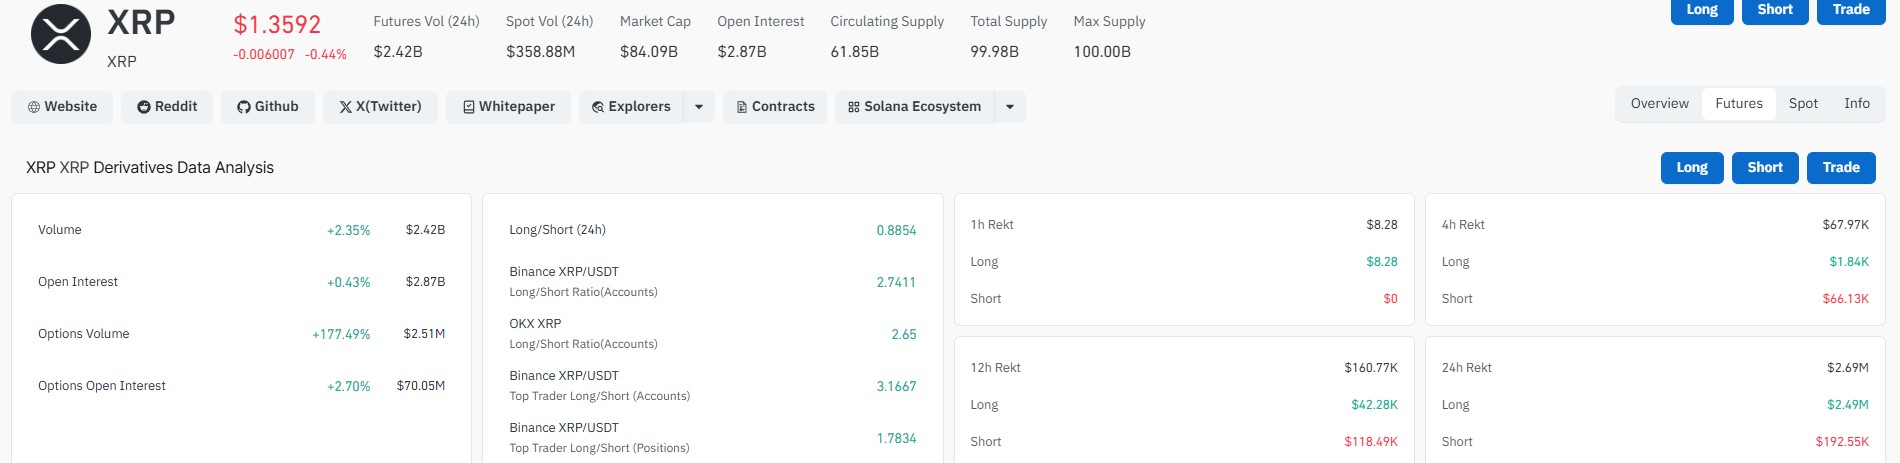
Looking at the monthly chart, $XRP is sitting right at the equilibrium zone near the $1.36 mark. The Fibonacci structure shows the next real resistance at $2.05, then $3.81, and further out at $6.09 and $10.43.
The current price zone is genuinely a key area. A failure to hold here could pull XRP back toward the 0.888 level around $1.52, and a clean hold with volume could be the setup for the next leg up.
The chart also shows a long-term megaphone structure with the "Final Wake Up Line" and "Atlas Line" acting as major boundaries. XRP has stayed inside this structure for years, and each time it has tested the lower boundary, a strong recovery followed.
Right now, price action is compressing near that equilibrium band, which historically builds energy before a move.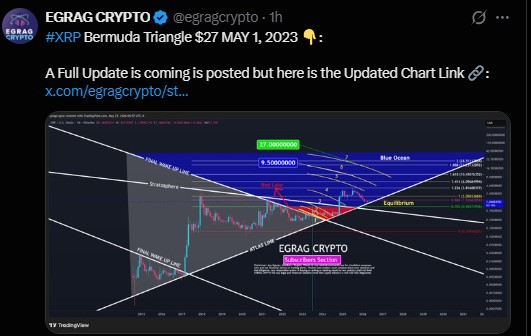
From an XRP technical analysis perspective, the current setup remains mixed. The RSI is near neutral territory, while derivatives positioning shows a split between bullish retailaccounts and more cautious larger traders.
The trading volume also needs to increase before a breakout can be considered reliable.
Traders watching the XRP forecast should focus on whether price can reclaimkey resistance with strong volume.
Asustained move above resistance could improve the price target outlook, while a breakdown would bringlower support zones into focus.
Solana Is Sitting in the Exact Zone That Matters
Solana is trading near $85.92, down 0.35% on the day. Market cap is $49.66 billion. Futures volume over 24 hours came in at $6.58 billion, but it dropped 15.19% compared to the previous period. That declining volume during a sideways move is actually typical for accumulation phases.
Declining volume during a sideways market can be consistent with an accumulation phase, although volume alone does not confirm that buyers are taking control.
The open interest for Solana sits at $5.54 billion, nearly flat with a -0.16% change. Options open interest, however, rose 3.41% to $117.73 million. Again, that tells you traders are watching this level closely.
The Long/Short ratio on Binance SOL/USDT accounts is 2.82, strongly bullish in terms of account bias. But the position ratio tells a more cautious story at 2.05, and 24-hour liquidations show $708,000 in long liquidations versus $5.56 million in longs still holding. That imbalance in liquidations shows shorts have been hurting more recently, which is quietly bullish.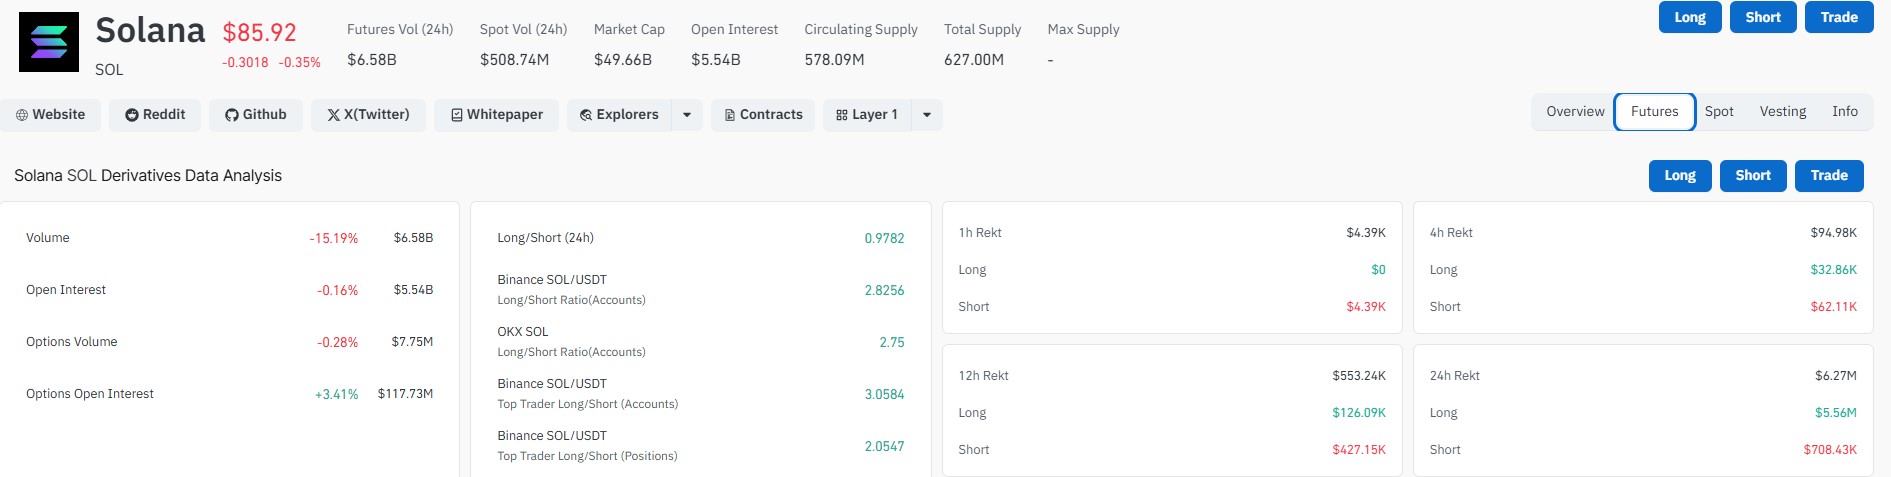
The weekly chart shows Solana sitting inside a defined accumulation zone between $57.05 and $78.32. Price is technically just above that zone at $86, holding a thin margin.
Earlier in 2025, SOL printed a double top near $263, which was a textbook exhaustion pattern. The correction that followed brought it straight back to this accumulation band.
What makes this zone meaningful is history. The last time Solana sat in a similar accumulation zone back in 2022 and 2023, it went on to gain over 2,000% from those levels.
As per Crypto Patel, the long-term chart targets from here are $500, $700, and $1,000. Those targets are based on the same structural levels that have guided price throughout SOL's entire history.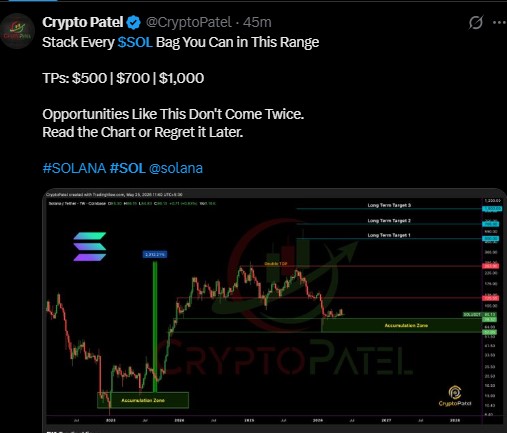
What Do XRP RSI, Moving Averages and Volume Show?
The current setup is basedon several indicators rather than one chart pattern. RSI is close to the neutral zone, suggesting momentum has notyet shifted decisively toward buyers. Traders are also monitoring XRP moving averages to determine whether the broadertrend is improving.
XRP trading volume is another important confirmation signal. A breakout above resistance without a meaningful increase in volume could prove weak. Bycontrast, rising volume alongside improving RSI and a bullish moving-average structure would strengthen the case for a sustained recovery.
Fibonacci levels also remain important for longer-term projections.Traders using Fibonacci levels are watching the major extension zones as potential future resistance andprice-target areas.
XRP vs Solana Price Analysis: Where Is Capital Rotating?
The key difference between XRP and Solana is relative strength. It is currently facing resistance from its broader downtrend, while Solana is trading closer to a long-term accumulation zone. This suggests thatcapital is not necessarily leaving both assets equally.
A useful XRP-SOL relative-strength chart should compare the XRP/SOL ratio against Bitcoin dominance and total altcoin market capitalization. If the $XRP/SOL ratio rises, it is outperforming Solana. If it falls, capital isrotating toward SOL instead.
This capital-rotation model helps explain why the total crypto market can rise while individual altcoins remain weak. Bitcoin-ledrallies often absorb liquidity first, followed by large-cap altcoins and thensmaller assets. Traders should therefore monitor relative strength rather than relying only on the total market cap.
For the current XRP-Solana price analysis, neither asset has yet produced adecisive confirmation that a sustained altcoin rotation has begun.
Are XRP ETF Flows Supporting the Price?
$XRP ETF flows remain an important factor in the current forecast. Institutional demand can provide astructural source of buying pressure, but ETF inflows need to remain consistentto have a meaningful impact on price.
The latest weekly ETF net-flow figure should be tracked alongside spot volume and futures open interest. If ETF inflows accelerate while trading volume increases, the combination could strengthen the bullish case. If ETF flows weaken while derivatives leverage rises, the market could become more vulnerable to a volatility-driven correction.
Why Are XRP and Solana Lagging as the Crypto Market Rises?
The simple reason is rotation. When Bitcoin pumps, money flows from altcoins into BTC first. That natural rotation temporarily pulls capital away from assets like XRP and Solana, keeping their prices flat or slightly lower even when the total market cap goes up.
The second reason is that both assets are still recovering from their 2025 highs. It touched the $3.50 zone earlier this year, and Solana touched $263. Pulling back from major highs takes time. The market needs to shake out weak hands, build a new base, and find fresh buyers before the next push.
The latest $RP Solana price analysis suggests that both assets are atimportant decision points rather than confirmed breakouts. It needs strongervolume and a move through key resistance, while Solana must continue defendingits long-term accumulation structure.
The traders shouldwatch ETF flows, futures positioning, RSI, moving averages, and the $1.00support zone. For Solana, the $57–$78 accumulation area remains critical.
If Bitcoin continues risingand capital eventually rotates into altcoins, both $XRP and SOL could benefit. However, a Bitcoin correction could quickly pressure both assets. For now, thekey question is not simply will $XRP go up tomorrow, but whether sustained capital rotation canfinally push these two major alt coins out of their current consolidation phases.
What Are Analysts Predicting for $XRP?
| Analyst / Model | Target |
| Standard Chartered | Around $2.80 |
| EGRAG Crypto | $7–$10 cycle range |
| Current Technical Setup | $2.05 first major resistance |
Thesetargets represent different time horizons and methodologies. Standard Chartered's projection is comparatively conservative, while EGRAG Crypto'srange reflects a stronger cycle scenario. The current technical setup remains more focused on whether $XRP can reclaim near-term resistance before highertargets become realistic.
XRP Bull, Base and Bear Price Scenarios
| Scenario | Target | Probability | Invalidation |
| Bull | $2.05–$3.00 | 25% | Break below $1.00 |
| Base | $1.36–$2.05 | 55% | Loss of $1.00 support |
| Bear | $0.85–$1.00 | 20% | Sustained market-wide risk-off |
These probabilities are scenario estimates basedon the current technical structure, derivatives positioning, volume, and broader market conditions. They are not guaranteed price outcomes.
This article is for informational purposes only and does not constitute financial advice. Always conduct your own research before making any investment decisions.

















