XRP Elliott Wave Analysis: Can XRP Reach $17 in 2026?


For abroader outlook, see our XRP price prediction 2026 analysis, which covers the wider market outlook and long-term price targets.
XRP isdoing something right now that most traders are completely ignoring. The priceis sitting around $1.36, moving sideways, but the broader structure is showingsigns of compression.
This XRP Elliott Wave analysis examines the current Wave-4 structure, key Fibonacci levels, support andresistance zones, and the potential Wave 5 targets for 2026.
Theprice is sitting around $1.36, moving sideways, and the majority of retailtraders have already moved their attention elsewhere. But zoom out on thechart, and a completely different picture shows up.
The structure is tightening. The compression is real. And basedon years of historical cycle behavior combined with a clean Elliott Wave setup, the next big move for $XRP looks like it isloading up right now in 2026.
Here is everything the charts are showing and why the $17 targetis not as crazy as it sounds.
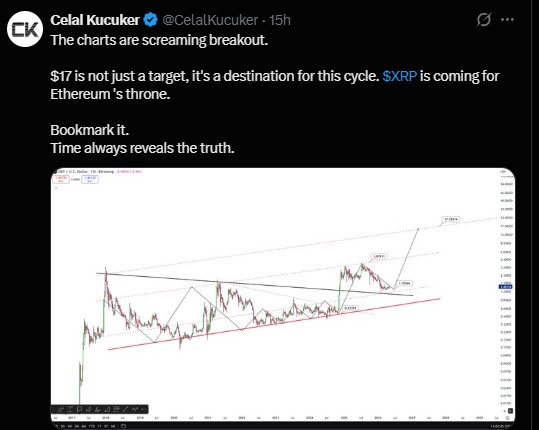
Where Is XRP Price Right Now in 2026?
The altcoin is currently trading in the $1.36 to $1.47 range, and this zone is more important than most people realize.
Traders tracking XRP support and resistance levels are watching this range closely because a breakout above resistance could confirm the next phase of the Elliott Wave-structure, while a breakdown below support could invalidate the bullish setup.
Two strong support levels are sitting just below the current price: $1.36 and $1.31. These are not random numbers pulled from thin air. Price has visited these levels multiple times, and buyers have shown up consistently each time. That kind of repeated defense tells you real demand exists at these prices.
Above the current price, $XRP faces three clear resistance walls: $1.47, then $1.88, and after that $3.56. These are zones where sellers have pushed prices back down in previous attempts. Breaking through each one is how XRP builds momentum toward the bigger cycle targets.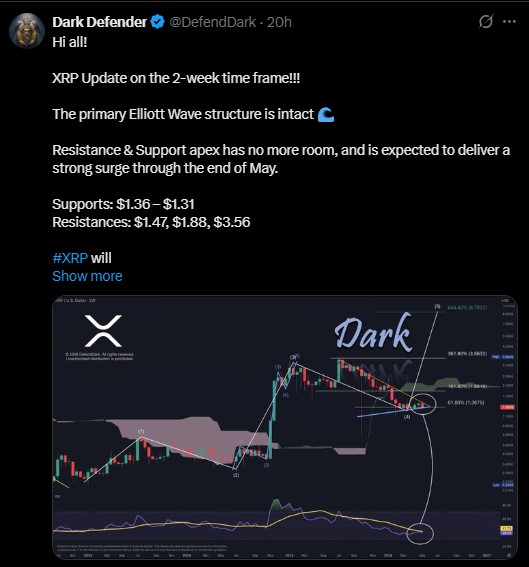
Right now, the price is pressing right up against the first resistance. The squeeze has almost no room left.
What Does Elliott Wave Theory Say About $XRP in 2026?
Elliott Wave analysis attempts to identify recurring market cycles through five impulsive waves and three corrective phases.
In this $XRP Elliott Wave analysis, the current structure is interpreted as a potential Wave-4 correction, with a possible Wave-5 expansion forming if key support levels continue to hold.
As per Dark Defender, the Elliott Wave structure on the 2-week $XRP chart is one of the cleanest setups in the entire crypto market right now.
The altcoin completed a powerful Wave-3 that pushed it past $3.50 during the 2024 to early 2025 rally. Since then, price has been working through Wave-4, which is always the messiest and most frustrating phase of the sequence.
Wave-4 corrections move sideways, chop in both directions, and test the patience of everyone holding through it.
But Wave-4 always ends. And when it does, Wave-5 is what follows.
The 2-week chart shows that the support and resistance apex is nearly out of room. This means the compression phase is approaching its final stage, and a strong directional move is coming very soon.
Based on Fibonacci extension measurements from the prior wave structure, Wave 5 carries a projected target of around $8.78 on the intermediate chart. The full macro wave target from the larger degree count sits at $17.53.
Momentum indicators should also be monitored along side the wave-count. XRP's RSI canhelp traders identify whether a potential Wave 5 breakout is becoming over extended, while moving averages can provide additional confirmation oftrend strength.
RSI alone does not confirm an Elliott Wave count, so traders should combine momentum signals with price structure and trading volume.
How Many Times Has XRP Done This Before?
Analysts have identified three major XRP market cycles, although the timing and structure of each cycle have not been identical.
As per Egrag Crypto, Cycle 1 peaked in 2013.
Cycle 2 peaked in late 2017 and pushed it to its former all-time high near $3.84 before a multi-year bear market followed.
Cycle 3 began building from 2023, and based on how the monthly chart is structured, it is shaping up to be the largest cycle yet, with targets ranging from $17 all the way up to $27.
Each cycle follows the same four stages. First comes a long, quiet accumulation period. Then a sharp breakout surprises the market. After that, a painful correction shakes out the weak hands.
Finally, a parabolic Wave-5 surge comes in and catches most people off guard because they had already given up and sold.
Based on where the cycle clock sits right now in 2026, XRP appears to be finishing that shakeout correction and preparing for the final leg up.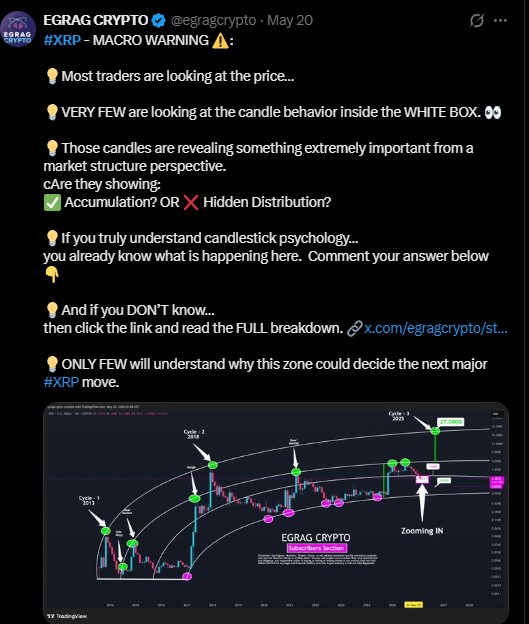
What Do XRP Candles Reveal About the Next Move?
This is the part most retail traders are completely missing.
Inside the current tight consolidation range, the individual candles are showing a very specific behavior. The wicks are getting shorter. The bodies are compressing.
This type of candle behavior before a major breakout usually means large players have already positioned themselves and are simply waiting for the trigger.
When the crowd gets bored, and volume dries up inside a tight range, that is often exactly when the smart money finishes loading.
However, declining XRP trading volume does not automatically prove that large investors are accumulating.
Whale accumulation should also be treated as a confirmation signal rather than proofof a guaranteed breakout.
If large-wallet balances increase alongside rising spot volume and improving price structure, it could strengthen the bullish case. However, whale transfers to exchanges could signal potential selling pressure.
A genuine breakout would ideally be accompanied by rising volume, stronger momentum, and a sustained move above key resistance levels. Without that confirmation, the current compression could still resolve to the downside.
The current candle structure fits that description closely, and it is something that historically shows up right before significant directional moves in crypto.
What Is the Realistic XRP Price Target for 2026?
Based on the full picture combining Elliott Wave counts, three-cycle history, Fibonacci levels, and current market structure, here is where XRP could realistically move in 2026.
From a technical perspective, traders should also monitor the key XRP Fibonacci levels alongside the Elliott Wave count. Fibonacci extensions can help estimatepotential Wave 5 targets, but these projections should be treated asscenario-based levels rather than guaranteed price outcomes.
Breaking $1.47 is the first confirmation signal. After that, $1.88 becomes the next target and a key decision zone for the market. Clearing $1.88 with strength opens the path toward $3.56, which is where many mid-term traders are likely to take profits.
Beyond $3.56, the wave projections point toward $8.78 as an intermediate target and $17.53 as the full cycle destination.
The $17 level is not a guess. It lines up with Fibonacci extension targets, cycle projection methods, and the historical behavior of XRP across prior bull markets.
Corrections will happen along the way. No move goes straight up. But for anyone watching the structure closely, the current setup near support in 2026 looks like the kind of opportunity that comes around once per cycle.
The charts have been building toward this. The compression is nearly done. And the next chapter may be the biggest one yet.
Scenario Target Probability Invalidation Assumption Bear $0.90–$1.30 25% Weekly close below $1.31 XRP fails to break $1.47 and loses key support Base $3.56–$8.78 50% Weekly close below $1.31 XRP breaks resistance and completes a moderate Wave 5 Bull $8.78–$17.53+ 25% Breakdown below $1.31 Strong Wave 5 expansion with bullish crypto market conditions
These probabilities are scenario estimates based on the current technical structure and should not be interpreted as statistical certainty.
How Do XRP Analyst TargetsCompare in 2026?
The $17.53 projection from the Elliott Wave structure represents an aggressive technical scenario rather than a consensus market target.
Other market analysts have published different XRP forecasts, highlighting how widely price expectations can vary.
Standard Chartered has previously discussed a lower multi-dollar XRP target, while EGRAG Crypto has presented much more bullishlong-term cycle projections.
These forecasts should be viewed separately from the Elliott Wave model because theyuse different assumptions and time horizons.
The key takeaway is that the $17 target is one possible bullish scenario, not a guaranteed outcome.
Investors should compare multiple forecasts while considering market capitalization, liquidity, institutional demand, ETF flows, and broader crypto market conditions.
Disclaimer: This article is for informational and educational purposes only. It does not constitute financial advice. Crypto markets are volatile and carry significant risk. Always do your own research before making any investment decision.
Also read:










.webp)






