XRP Price Prediction 2026: Can XRP Reach $10 in 11 Months?

XRP Price Prediction: Can the Token Reach $10 Before Mid-2027?
XRP is trading near $1.13 as of late June 2026. It has been stuck in a tight range after a sharp pullback from its recent highs above $3.00.
The key question for this XRP price prediction 2026 is simple: can XRP reach $10 within the next 11months?
But some analysts are not worried. They say the current price zone is exactly where patient buyers should be positioned.
What Does the XRP Chart Show Right Now?
A weekly chart shows XRP sitting right at two key support levels.
This XRP technical setup also puts the $1.10–$1.13 area at the center ofthe current $XRP support and resistance structure.
A long-term green support line and a blue horizontal zone are both converging near the $1.10 to $1.13 area.
The price is also resting at the lower end of what analysts call the Gaussian Channel. This is a volatility-based band.
Historically, $XRP has launched from the lower boundary of this channel.
A red descending trendline from early 2025 highs is also meeting the price here. That makes this zone a cluster of confluences that traders watch closely.
This $XRP forecast combines trend structure, support and resistance, momentum, movingaverages, and historical cycle behavior.
RSI isused to assess momentum, EMAs help identify trend direction, and trading volumehelps confirm breakouts, while MVRV can provide an additional valuation signal when reliable data is available.
These indicators are combined with institutional adoption and broader market conditions rather than relying on a single technical signal.
What Is $XRP's Central Line and Why Does It Matter?
The Central Line is a long-term macro average. It separates two phases in price history.
Below it: slow accumulation with low volatility. Above it: fast expansion with sharp gains.
One analyst on X noted that the 265% target above the Central Line comes from averaging two past cycles.
One cycle saw about 330% expansion above the line.
Another saw roughly 200%. The average of those two gives about 265%, which maps to a price near $8.00.
The more conservative case, set at 120%, gives a lower target near $5.70.
That makes the Central Line framework relevant to both the $XRP price target 2026 andthe longer-term question of how high can it go.
Neither target is a guarantee. They are based on how far the altcoin has moved above its Central Line in previous bull runs.
Is XRP Showing a Momentum Bottom Like Past Cycles?
Analyst Javon Marks shared a long-term momentum chart showing $XRP historical pattern. Each time momentum hit a bottom zone, a major rally followed.
The chart shows multiple such bottoms, each marked with a circle. After everyone, it moved more than 10x.
The current reading is showing a similar setup. The momentum indicator is sitting in a historically low zone again.
The analyst pointed to a target above $15 if the pattern repeats. That would be more than 1,000% from current levels. It is an aggressive target, but not outside the range of what it has done before.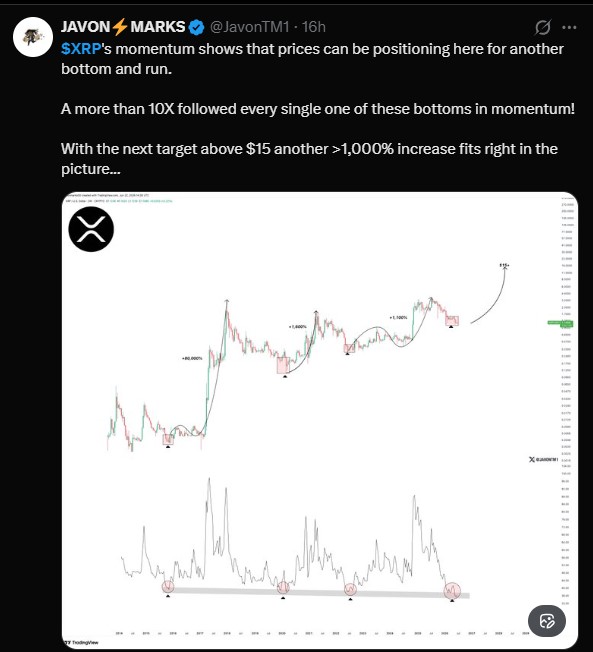
However, this is an aggressive technical projection rather than a consensus XRP forecast 2026, and it depends entirely on the historical pattern repeating.
Can $XRP Reach $10 Within the Next 11 Months?
The second chart shows a specific projection. Starting from current price levels near $1.13, one scenario shows a cup-and-handle style move.
Price dips slightly, forms a base, then pushes to around $3.40 first. That level is marked as a prior resistance zone. After consolidating there, a second push targets $10.36.
The projection labels both legs at 201.45% and 201.46% gains. Those are not random numbers. They are based on the same percentage move applied twice to match prior cycle behavior.
If the altcoin follows this path, it would reach $10 sometime between mid-2026 and early 2027, based on the chart timeline.
What Would XRP Need to Reach a $10 Price Target?
At a $10 price, its implied market capitalization would depend on its circulating supply at that time.
Usingthe current circulating supply, a $10 $XRP valuation would represent asignificant increase from its present market capitalization.
The target therefore requires not only technical momentum but also sustained demand, deeper liquidity, and a broader expansion in the crypto market.
The capital required to reach a $10 market cap would not necessarily equal the full increase in market capitalization, because market cap is calculated from price multiplied by circulating supply.
However, the move would still require substantial new demand and liquidity.
XRP Price Target 2026: How Analyst Forecasts Compare
Analyst forecasts vary significantly. Standard Chartered has previously outlined a more conservative multi-dollar outlook, while 21 Shares has presented separate bear,base, and bull cases.
CoinCodex and Changelly also publish model-based forecasts that differ depending on their methodology.
How Does XRP Compare to Ethereum in This Cycle?
Some analysts believe XRP will outperform ETH in this cycle. That view is not new. In 2017, $XRP massively outperformed most large-cap tokens.
The argument centers on XRP's legal clarity post-SEC case, its use in cross-border payments, and its compressed price after years of under performance.
Ethereum has its own catalysts. But XRP's structure, sitting near multi-year support with momentum at a low, is seen by some as offering a better risk-to-reward setup at current prices.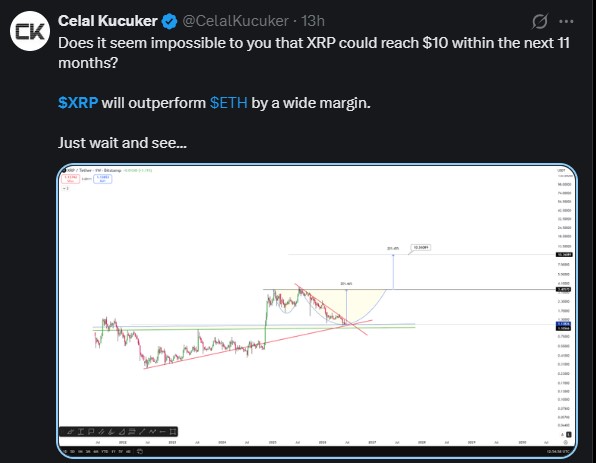
Could XRP ETF Approval Help Pushthe Price Higher?
XRP ETF approval could improve institutional access and potentially increase demand for the token. However, ETF approval alone would not guarantee a move to $10.
The size of actual inflows, broader crypto liquidity, market sentiment, and $XRP's market-cap expansion would all determine how much impact ETF demand has on price.
What Are the Key Price Levels to Watch for $XRP?
-
$1.10: Strong support. A break below this would shift the bias bearish in the short term.
-
$1.30: First resistance. The blue horizontal zone from 2022 to 2024.
-
$3.40: Major resistance from the 2025 peak. A weekly close above this would be significant.
-
$5.70: Conservative cycle target based on Central Line projections.
-
$8.00: Average cycle target based on historical expansion above Central Line.
-
$10.36: Aggressive target based on double 201% extension pattern.
XRP Price Prediction 2026: Bull, Base and Bear Cases
| Scenario | 2026 Target | Probability | Key Assumption | Invalidation |
| Bear | $1.00–$1.60 | 25% | Weak crypto market and loss of major support | Sustained recovery above key resistance |
| Base | $2.00–$3.00 | 50% | Gradual institutional adoption and improving market conditions | Breakdown below major macro support |
| Bull | $5.00–$10.00+ | 25% | Strong bull cycle, institutional demand and major liquidity expansion | Failure to reclaim major cycle resistance |
What Could Go Wrong With These $XRP Projections?
Technical analysis is not a guarantee. Charts can break down. Broader market conditions matter.
A sustained break below $1.10 would weaken the bullish thesis and could shift the XRP forecast toward the $0.75 support area.
A Bitcoin selloff, a regulatory change, or a macro shock could push below key support. If $1.10 breaks on high volume, the next support sits closer to $0.75.
Liquidity conditions in 2026 are also uncertain. Interest rates, risk appetite, and crypto adoption trends all influence price action at this scale.
These price targets assume the current bull cycle continues. If it does not, these levels become irrelevant.
Disclaimer: This article is for informational purposes only and does not constitute financial advice. Cryptocurrency investments are highly volatile and carry significant risk. Always conduct your own research and consult a licensed financial advisor before making any investment decisions.
















