Zcash Price Prediction: ZEC Breakout Puts $588 in Focus


Zcash price prediction traders are watching something ZEC hasn't managed in weeks, and the reaction that followed has the market split down the middle.
After a long stretch of getting turned away at the same falling ceiling, ZEC finally pushed through, only for a sharp move in the opposite direction to show up right after and cloud the picture.
Is this the start of a real reversal or a trap before another leg down? This Zcash price prediction breaks down exactly what needs to happen next for either side to win out.
This analysis is based on a 1-hour chart structure and short-term liquidation data, so it reflects near-term positioning only and should be rechecked if price moves outside the range below.
Prepared by CoinGabbar's technical desk; neither CoinGabbar nor the analyst holds a position in ZEC at the time of publication. This is not financial advice.
Zcash Price Right Now
Metric | Value |
Current Market Price (CMP) | $478.02 |
24h Change | -2.57% (-$12.609) |
24h Futures Volume | $1.28B |
24h Spot Volume | $92.12M |
Market Cap | $8.03B |
Open Interest | $856.34M |
Circulating Supply | 16.81M ZEC |
Max Supply | 21.00M ZEC |
CMP refers to the current market price, and open interest is the total value of futures contracts still open on an exchange.
At $856.34M, Zcash's open interest is unusually large relative to its market cap, showing that a significant share of recent activity is coming from leveraged futures trading rather than spot buying alone.
Source: CoinGlass, captured 12 August 2026, 12:24 IST (06:54 UTC). Chart source: TradingView, ZEC/USDT Perpetual, OKX, 1-hour timeframe, same timestamp.
Where Zcash Trading Volume Is Coming From
Futures volume is heavily concentrated on a handful of exchanges. 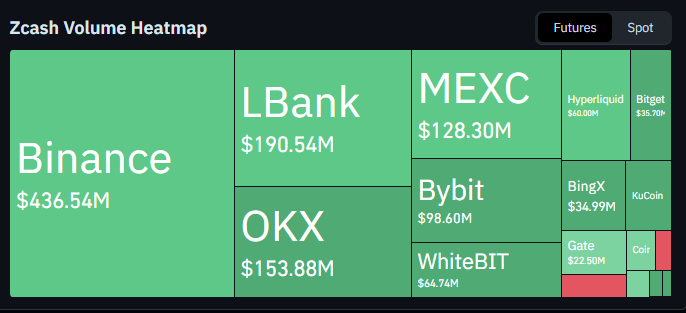
Binance leads with $436.54M in 24-hour futures volume, followed by LBank at $190.54M and OKX at $153.88M.
MEXC, Bybit, and WhiteBIT round out the next tier, while smaller platforms like Hyperliquid and Bitget contribute a combined share under $100M.
This concentration on a few large venues means moves on Binance and OKX in particular tend to set the tone for ZEC's broader price action.
Source: CoinGlass Zcash volume heatmap, same timestamp.
Zcash's Longer-Term Performance Puts the Setup in Context
Zooming out helps frame how significant the current move actually is.
ZEC is down 2.57% over 24 hours and 5.50% over the past week, and it has f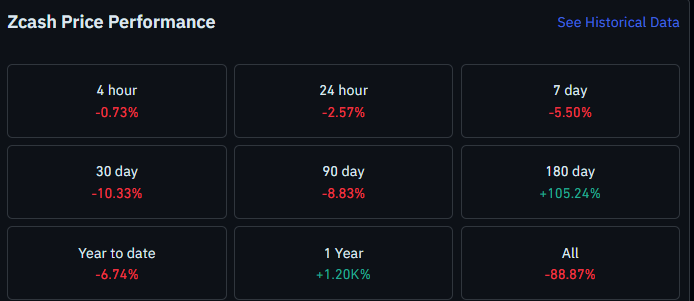 allen 10.33% over the past 30 days.
Despite that recent pullback, the picture looks very different further out: ZEC is still up 105.24% over the past 180 days and roughly 1,200% over the past year, even though it remains 88.87% below its all-time high.
In other words, this trendline test is happening inside a much larger uptrend that has cooled off in the short term rather than reversed outright.
Source: CoinGlass Zcash price performance data, same timestamp.
Liquidation Data
Liquidations over the past day lean toward long positions getting caught out. In the last hour, $106.90K was liquidated in total, with longs taking $77.26K against $29.64K in shorts. 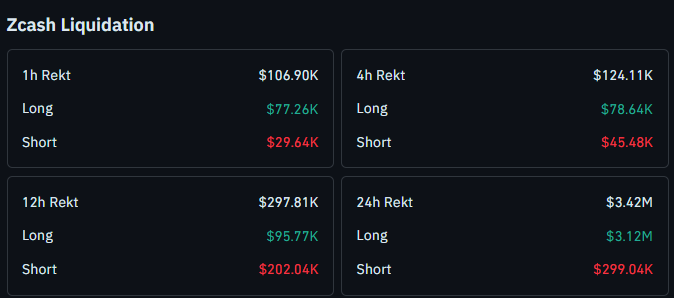
Over 4 hours, $124.11K was liquidated, again skewed toward longs at $78.64K versus $45.48K in shorts.
The 12-hour window flips slightly, with shorts taking the bigger hit at $202.04K against $95.77K in longs, out of $297.81K total.
Over 24 hours, $3.42M was liquidated in total, and longs dominated heavily at $3.12M against just $299.04K in shorts, consistent with the sharp red candle that followed the trendline breakout.
Source: CoinGlass, same timestamp.
Key Takeaways
ZEC trades near $478.02, down 2.57% over the past 24 hours, right at its breakout zone
A close above $489.10 would confirm the trendline breakout, targeting $530.50 and $588.81
A close below $478.70-$480.20 would put the breakout in doubt in the near term
A close below $466.50 invalidates the setup, with $451.96 as the next support
Long positions took the largest share of liquidations over the past 24 hours
Zcash Price Prediction: What the Chart Shows
ZEC spent an extended stretch rejecting off a descending trendline before finally breaking above it. 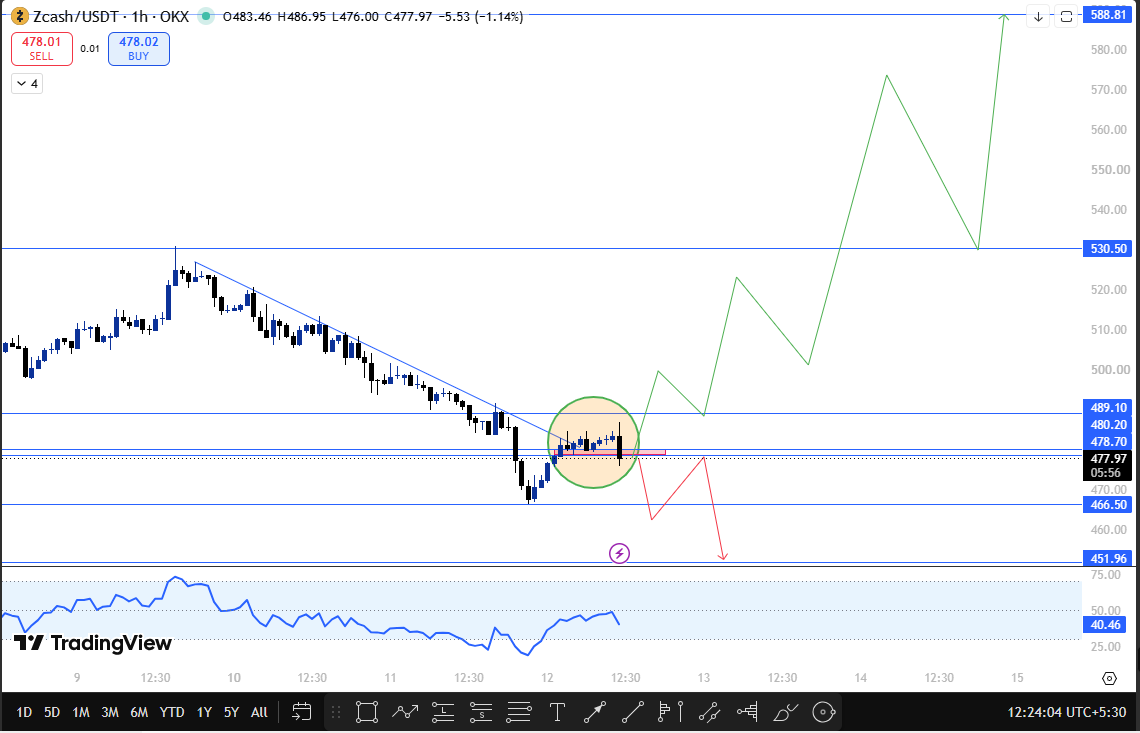
Price held above that trendline briefly, but the move was quickly followed by a large red candle, noticeably bigger than the recent candle range, which has pulled price back down toward the breakout zone.
That breakout zone sits between $478.70 and $480.20. A close below this range in the near term would suggest the breakout is losing strength, even though the trendline itself has technically been cleared.
The RSI, a momentum indicator that measures how fast and how far price has moved, is currently reading 40.46 on this chart, below the neutral 50 level. This lines up with the recent red candle and points to fading short-term momentum despite the earlier breakout.
Confirmation for the bullish case comes on a close above $489.10.
That would validate the trendline breakout and put $530.50 in view first, followed by $588.81 further out.
On the downside, if price continues falling from here, $466.50 is the next support to watch.
A close below that level would invalidate this setup, and $451.96 becomes the next zone traders would look to.
Zcash Support and Resistance Levels to Watch
Type | Level | Note | % From CMP |
Breakout zone | $478.70 - $480.20 | Needs to hold to keep the breakout intact | +0.1% to +0.5% |
Confirmation trigger | $489.10 | Close above this confirms the breakout. | +2.3% |
Resistance | $530.50 | First target after confirmation | +11.0% |
Resistance | $588.81 | Extended target | +23.2% |
Support | $466.50 | Next level down if the breakout zone fails | -2.4% |
Invalidation support | $451.96 | Setup is invalidated if $466.50 breaks and closes below. | -5.5% |
Risk-Reward Table
Case | Trigger | Target |
Bull Case | Close above $489.10 | $530.50, then $588.81 |
Bear Case | Close below $466.50 | $451.96 |
What Would Change This Zcash Price Prediction?
This setup stays intact as long as price holds above $466.50. A close below that level on continued selling would invalidate the bullish read entirely and shift focus to $451.96.
On the upside, the breakout only gets confirmed on a close above $489.10, not simply on holding the current breakout zone, since the large red candle that followed the trendline break has introduced real doubt about near-term strength.
These levels should be rechecked if price closes decisively outside this range within the next 24 hours.
Glossary
Trendline Breakout: A move where price closes above a descending trendline that had previously capped rallies.
Open Interest: The total value of futures contracts still open on an exchange.
RSI (Relative Strength Index): A momentum indicator, scaled 0-100, that shows whether an asset is being bought or sold aggressively relative to its recent range.
Liquidation: The forced closing of a leveraged position once losses exceed available margin.
Disclaimer
DisclaimerThis content is for informational purposes only and does not constitute financial or trading advice. Cryptocurrency markets are highly volatile and leveraged positions carry substantial risk of loss. Always do your own research before making trading decisions. CoinGabbar and the analyst do not hold a position in ZEC at the time of publication.
Also read:

















