Cosmos Price Prediction: Can ATOM Clear $1.508 Resistance?


ATOM Is Climbing Again. Resistance Is About To Find Out If It Is Real.
Cosmos price prediction discussions are shifting tone as ATOM claws back from its late July slide, now trading near $1.42.
The token has built a genuine 4-hour ascending channel since early August, with a string of higher lows replacing the selling that dominated the prior month.
That structure alone does not erase months of weaker performance, but it does give buyers something concrete to defend for the first time in a while.
Why Is ATOM Moving Higher Right Now?
ATOM is up about 2.6 percent over the past 24 hours and 3.63 percent over the past week, a rare stretch of green after a rough 30- and 90-day stretch that left the token down 9.01 percent and 30.24 percent, respectively.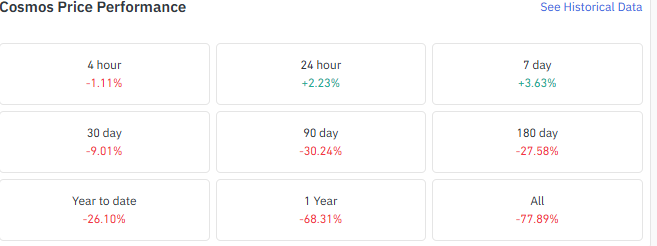
The recovery is coming from finding buyers at lower levels and building on that momentum inside the current channel.
Traders Are Leaning Long, But Resistance Has Not Broken Yet
Derivatives long/short up with the recovery story. The Binance ATOM/USDT long short ratio sits at 1.70, top trader accounts lean even further at 1.91, and top trader positions sit near 1.69.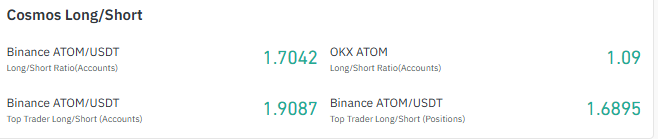
OKX accounts show a smaller but still long-leaning 1.09. Positioning is more aligned with price direction than it has been in recent bearish stretches.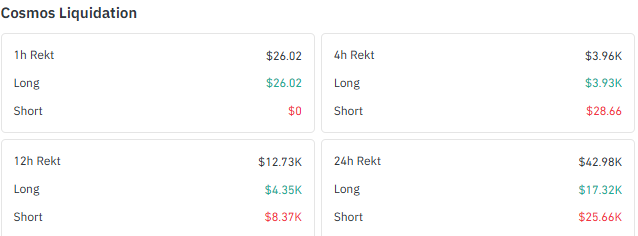
Liquidation data over 24 hours actually shows shorts taking the bigger hit, $25.66K against $17.32K in longs, consistent with the broader bounce catching bearish bets off guard.
The more recent 4-hour window tells a different story, though; almost all of that liquidation total came from longs, a sign that some traders chasing the move higher got caught in the pullback.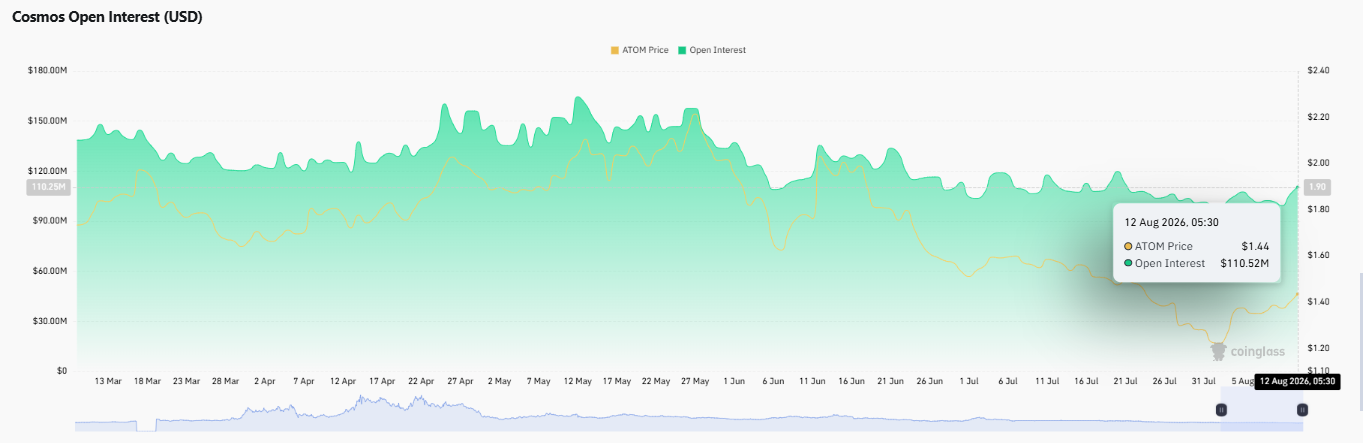
Open interest remains substantial near $110.52 million, showing leveraged positioning is active even as price works through resistance rather than proving fresh conviction on its own.
Data source: Coinglass
The 4-Hour Chart Still Favors Buyers
ATOM is trading inside a clear ascending channel on the 4-hour timeframe, built from a sequence of higher lows since the early August bounce.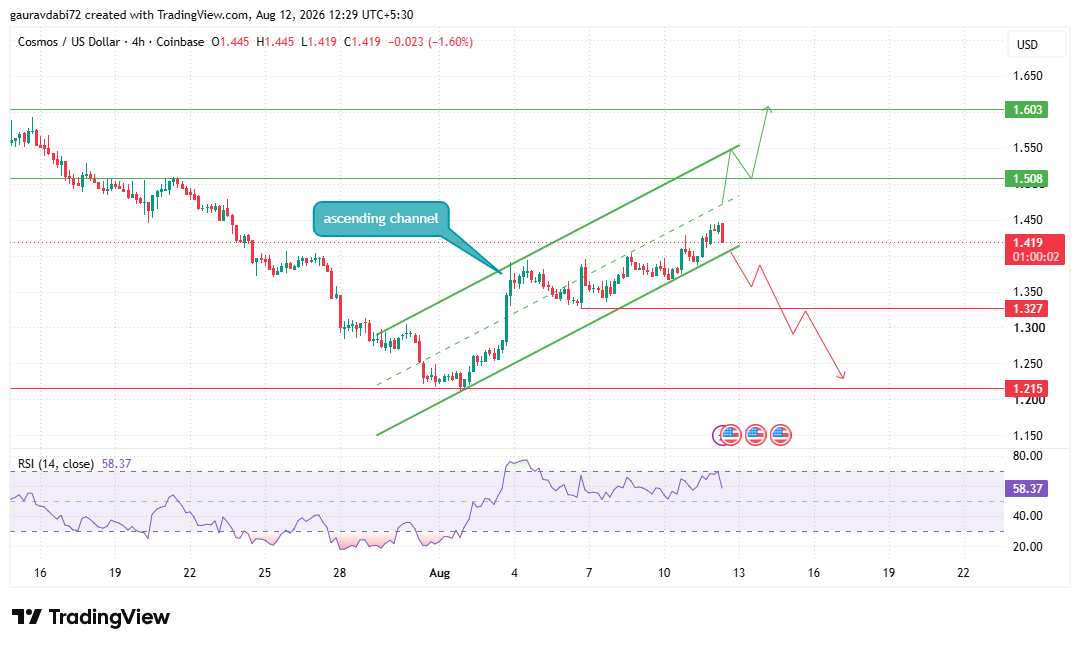
Price recently pushed toward the upper half of that structure before pulling back, and the pullback has not broken the channel itself. The 4-hour RSI sits at 58.37, above the neutral 50 mark, which shows momentum still favors buyers without pushing into overbought territory.
There is still room for this move to extend before RSI itself becomes a concern.
Data source: TradingView
Cosmos Support and Resistance Levels To Watch
$1.327 is the level that keeps this recovery credible. It sits near the lower part of the current structure, and a confirmed break below it would weaken the ascending channel and put $1.215 back in play.
On the upside, $1.508 is the first real hurdle; the price needs to absorb selling there while staying inside the channel before the recovery can extend.
A clean move through $1.508 with continued strength could bring $1.603 into the conversation, though that level is far from guaranteed and depends entirely on how price behaves at resistance first.
Cosmos Price Prediction Scenarios
Scenario | What It Would Take |
Bull Case | ATOM clears $1.508 while staying inside the ascending channel, which could bring $1.603 into focus if strength continues. |
Consolidation | ATOM stays inside the channel between $1.327 and $1.508, keeping the recovery alive without confirming another leg higher. |
Bear Case | ATOM loses the ascending channel and breaks below $1.327, shifting attention toward $1.215. |
What Does ATOM Need To Prove Next?
As per Coin Gabbar analyst ATOM has built a healthier short-term structure than its longer-term performance would suggest. The ascending channel, RSI above 50, and long-heavy positioning all support the recovery case, but $1.508 remains a meaningful test rather than a formality. The structure loses credibility if $1.327 breaks, which keeps this a conditional recovery rather than a confirmed trend change.
Where This Leaves ATOM
For now, ATOM has earned the benefit of the doubt on the 4-hour chart without earning a breakout.
The next few sessions around $1.508 and $1.327 should say more about this Cosmos price prediction than the percentage gains already on the board.
Disclaimer: This article is for informational purposes only and should not be treated as financial advice. Cryptocurrency markets are highly volatile, and prices can move sharply in either direction. Readers should conduct their own research and consult a qualified financial advisor before making any investment decisions.
Also read:

















