Zcash Price Prediction: Traders Eye $ZEC Rally Toward $650


So what's the story behind this Zcash price prediction today? ZEC trades near $505, up slightly, sitting well above where it spent most of this year.
Market cap holds close to $8.5 billion, a level that's pushed ZEC back into the conversation among the larger privacy-focused coins.
Long-term holders have watched this one swing hard in both directions before, and the current setup has traders paying closer attention than usual.
Nothing about the current price screams certainty either way, though, just a coin sitting right at a decision point.
Live Market Data
For this Zcash price prediction, $ZEC trades at $505.30, up 0.8% over the past 24 hours, according to live exchange pricing. The day's range has run between $500.67 and $516.68.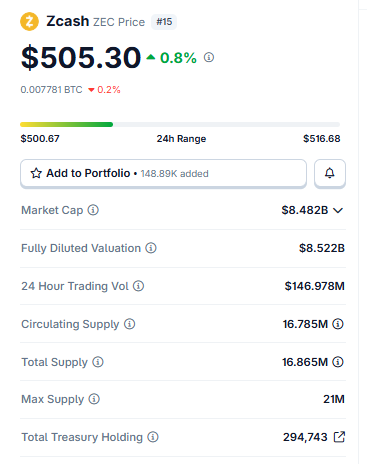 Source: Zcash market cap data taken from Coingecko, data as of Aug 08, 2026. Figures may vary slightly across other tracking websites.
Market cap sits near $8.482 billion, with fully diluted valuation close behind at $8.522 billion. Trading volume over 24 hours came in at $146.978 million.
Circulating supply stands at 16.785 million tokens against a 16.865 million total and a 21 million max supply, with 294,743 ZEC held in treasury.
Liquidation Data
Shorts are taking the bigger hit lately, a shift worth noting. One hour: $4.54K total, $4.03K from longs against just $513.01 in shorts.
Four hours of flips that round out to $27.36K total, with shorts absorbing $22.41K of it. 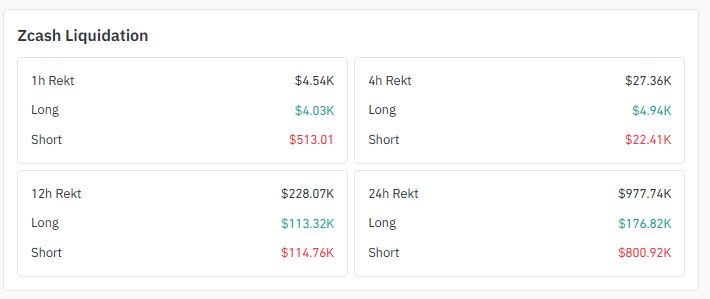
Source: Liquidation Data Taken From Coinglass.
Twelve hours out, it's close to even, $113.32K longs against $114.76K shorts, for a total of $228.07K.
Zoom out to a full day, though, and shorts clearly lead, $800.92K against $176.82K in longs, $977.74K liquidated overall, according to Coinglass data.
Exchange Volume
Binance leads ZEC futures activity by a wide margin, with $305.57M in volume, per live exchange heatmap data.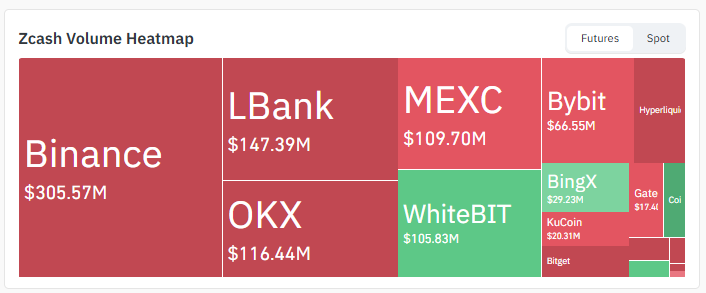
Source: Volume Heatmap Data Taken From Coinglass.
LBank follows at $147.39M, OKX at $116.44M, and MEXC at $109.70M.
WhiteBIT logged $105.83M, Bybit $66.55M, and BingX $29.23M, with KuCoin and Gate rounding out the smaller end of the tail.
Key Takeaways
-
$505.30. That's ZEC right now, up 0.8% on the day and the anchor point for this Zcash price prediction.
-
On the 4H chart, price is testing the rising trendline of an ascending triangle. Bounce there, or clear the triangle's resistance, and $544.20 opens up, then $560.18.
-
Break the trendline instead, and $488.72 comes into range, $470.42 not far behind.
-
The daily chart shows ZEC inside a symmetrical triangle. Break the upper boundary with volume, and $588.53 is next, eventually $690.32.
-
Break the triangle's rising trendline on the daily, though, and $376.67 comes back into focus, then $297.80.
-
A Wolfe Wave pattern on both timeframes points toward the upside levels, near $544.04 on the 4H and $657.46 on the daily, per TradingView chart data.
Technical analysis for the $ZEC price prediction.
Here's what both timeframes behind this Zcash price prediction actually show, based on the TradingView chart structure.
4-Hour Chart Analysis of $ZEC Price Prediction:
Price is inside an ascending triangle and testing the rising trendline of that structure right now.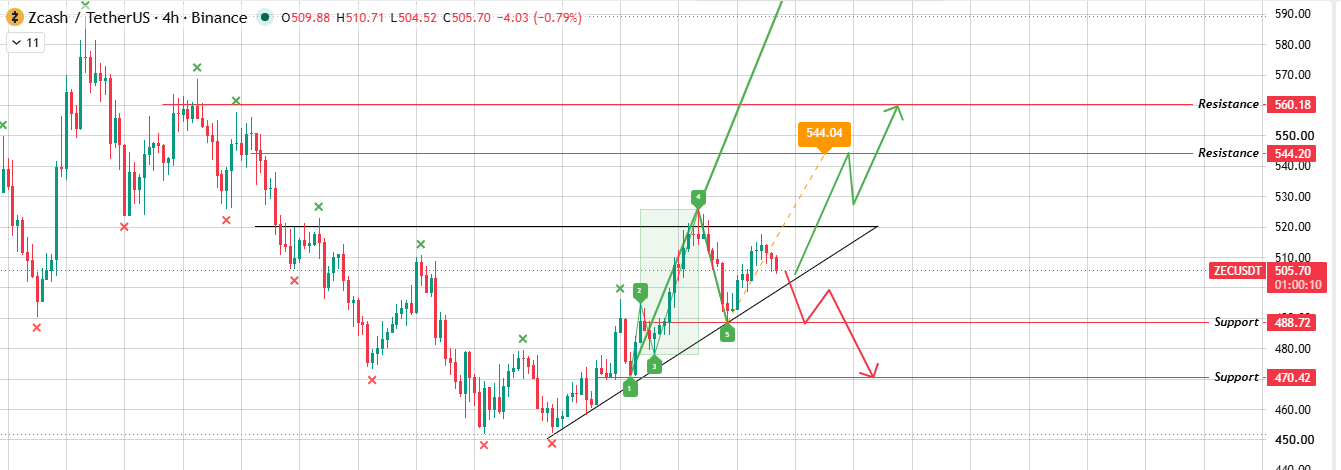
Source: Chart Taken From TradingView.
Bounce from there, or break the triangle's resistance, and it heads toward the upper levels, $544.20 first, then $560.18.
A Wolfe Wave pattern on this timeframe points toward that same breakout zone, with a projected level near $544.04.
Break the trendline instead, and the price heads toward the lower levels, $488.72 and then $470.42.
Daily Chart Analysis of $ZEC Price Prediction:
The Zcash price sits inside a symmetrical triangle on the daily. 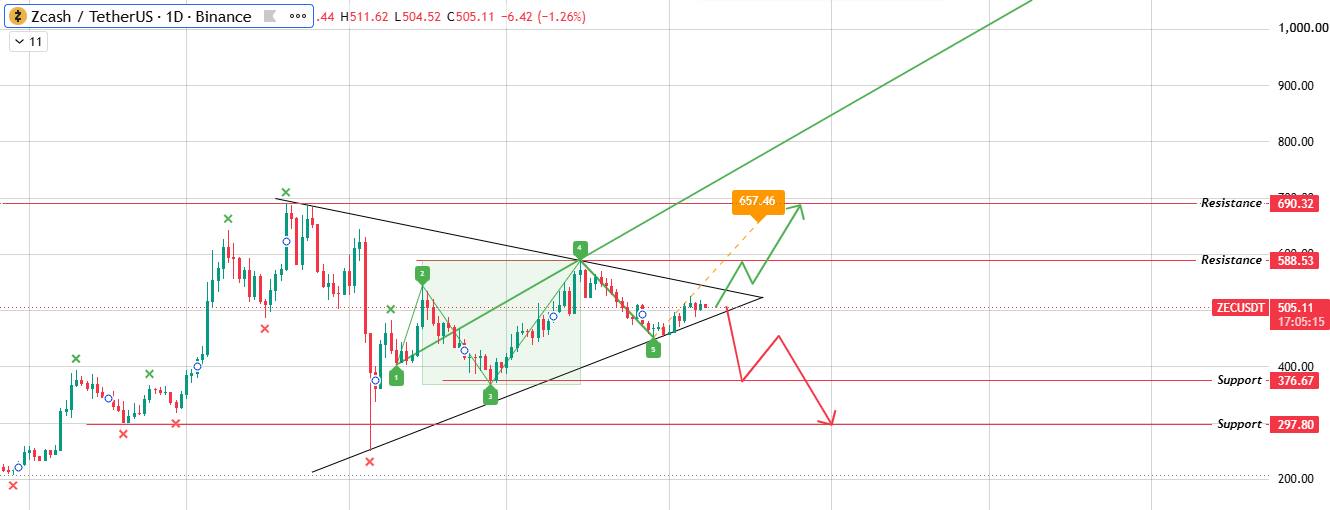
Source: Chart Taken From TradingView.
Break the upper boundary with volume, and it goes toward the upper levels, $588.53 first, then $690.32, a move the Wolfe Wave here also points toward, with a projected level near $657.46.
Break the rising trendline instead, and it heads toward the lower levels, $376.67 and then $297.80.
Bull, Base, and Bear Case
Glossary
Two lines closing in from opposite sides, one flat or rising, and one sloped down that's a symmetrical triangle, and it usually resolves with a real breakout.
An ascending triangle works a bit differently: flat resistance up top, a rising trendline underneath, and price getting squeezed until one side gives.
Ever heard of a Wolfe Wave? It's a five-point wave pattern that traders use to project where a breakout is likely headed.
Resistance is a zone where selling has capped the price before, making the first push through tougher than it looks.
Support, or a rising trendline in this case, works the other way, a level buyers keep defending until they can't anymore.
Methodology: Every level in this Zcash price prediction traces back to 4H and daily chart analysis on TradingView, including the Wolfe Wave pattern marked on both timeframes. Liquidation figures come from Coinglass, and exchange volume from live futures heatmaps. Nothing here gets extrapolated beyond what that data actually shows, and each scenario above carries its own stated invalidation level.
Disclaimer: This article is for informational purposes only and does not constitute financial advice. Cryptocurrency markets are highly volatile and speculative. Estimated probabilities reflect technical analysis of chart patterns, not certainty. Always conduct independent research and consult a licensed financial advisor before making investment decisions
















