Shiba Inu Price Prediction: Is SHIB Ready to Break This Resistance?

A token that's spent months grinding inside the same rising channel just pushed up against its ceiling again, and the chart is not giving a clean answer either way. Whale wallets still hold most of the supply. Volume just fell hard even as price ticked up. Nobody's celebrating yet, and that's exactly why Shiba Inu price prediction searches keep climbing this week.
So does this channel finally break, or does it get rejected one more time? That question is sitting at the center of most SHIB price prediction chatter right now, a follow-up to the setup covered in SHIB's next move. Here's what the chart, the holder data, and the liquidation feed actually show.
Shiba Inu Price Prediction: Why SHIB Is Coiling Near Resistance
Shiba Inu (SHIB) has been trading inside a well-defined ascending channel on the daily chart for months, and trades are now compressed close to the upper boundary of that structure.
Turns out, the squeeze itself isn't the story. What happens once it breaks is.
There's no fresh listing news behind this move. No partnership announcement. Just a slow grind higher, thinning volume, and a supply base that's still overwhelmingly concentrated in a handful of wallets.
When the team pulled the daily chart, the holder breakdown, and the liquidation feed together, one thing stood out fast: this looks like a coiled setup, not a confirmed breakout. What did the data actually say?
Key Takeaways
SHIB trades near $0.0000053 as of the latest snapshot (September 13, 2026, roughly 14:00 UTC), up about 1.16% over 24 hours.
The daily chart holds inside an ascending channel, with trades pressed against the upper boundary. RSI 14 reads 52.19, sitting in neutral territory.
24-hour trading volume fell to $48.42 million, down 36.79% even as price rose, a split worth watching.
Liquidations stayed light, but shorts took the bigger hit over 24 hours at $6.93K against $3.19K in longs.
Circulating supply sits near 589.23 trillion SHIB, with total and max supply both close to 589.5 trillion.
Holder data shows heavy concentration: the top ten wallets hold 82.73% of supply, and whale wallets alone control 94.78%.
Token Contract
Contract Address: 0x95ad61b0a150d79219dcf64e1e6cc01f0b64c4ce
Standard: ERC-20
Chain: Ethereum
Where SHIB Stands Right Now
SHIB last changed hands around $0.0000053, up roughly 1.16% over the past 24 hours per CoinMarketCap's SHIB listing. The 24-hour range ran between a low of $0.0000052 and a high of $0.0000054. Tight range. Not much drama in either direction yet.
Market cap stood near $3.1 billion, with unlocked market cap matching it almost one-to-one.
Here's the thing: volume told a different story than price did. 24-hour trading volume came in at $48.42 million, down sharply by 36.79% from the prior session. Volume-to-market-cap ratio sat at just 1.55%, and liquidity relative to market cap was thinner still at 0.14%.
Total supply reads at 589.49 trillion SHIB, max supply caps out at 589.55 trillion, and circulating supply sits at 589.23 trillion SHIB, verified on-chain.
The all-time high, $0.00008845, was set on October 28, 2021, roughly five years ago. Current price sits well over 94% below that peak. The all-time low, a tiny $0.0000000000816, dates to August 27, 2020.
Why Is SHIB Price Up Today
The price is grinding against the top of a channel it's held for months, and the RSI 14 reading of 52.19 shows momentum that's steady but not aggressive. Buyers aren't rushing in. But sellers aren't dominating either.
And that falling volume matters here. A price gain on shrinking volume usually means conviction is thin, not that a breakout is confirmed, a pattern worth reading against the wider Dogecoin vs Shiba Inu comparison in the meme coin sector this week.
Technical Analysis: Daily Chart
On the daily SHIB/USDT chart on Binance, the price trades inside a well-defined ascending channel, with the EMA 9 on trading levels sitting at $0.00000526, just under the current price.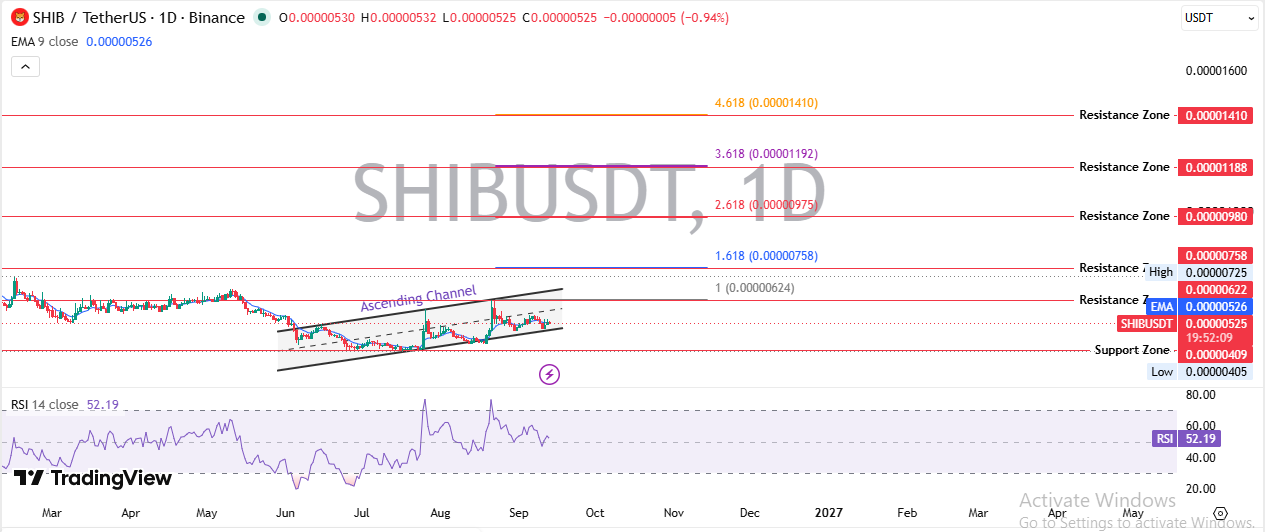
RSI 14 reads 52.19, squarely neutral. Not overbought. Not oversold either.
Above current trading levels, resistance builds in layers. The first wall sits at $0.00000622, then $0.00000725, then a stronger zone at $0.00000758. Beyond that, Fibonacci extension levels mark bigger targets: $0.00000980 at the 2.618 level, $0.00001188 at 3.618, and $0.00001410 at 4.618.
Support and Resistance Snapshot (Daily)
Level | Price |
Resistance 4 | $0.00001410 |
Resistance 3 | $0.00001188 |
Resistance 2 | $0.00000980 |
Resistance 1 | $0.00000758 |
Near-term Resistance | $0.00000622 |
Current Price | $0.00000530 |
Support 1 | $0.00000409 |
Support 2 | $0.00000405 |
Support sits fairly far below current trading levels. That gap gives the channel room to breathe before any real damage shows on the chart, a structure similar to the one flagged in the SHIB bull run resistance signal.
Liquidation Data In Real Time
Breaking: liquidation data stayed light across every timeframe, but the split between longs and shorts is worth a look.
Over the last hour, $1.73K got liquidated. Longs ate $1.72K of that. Shorts took just $16.16.
Over four hours, total liquidations reached $3.61K. Over twelve hours, that climbed to $4.55K.
Over 24 hours, liquidations rose to $10.11K, with $3.19K in longs and $6.93K in shorts wiped out. Shorts took the bigger hit on the daily window, a flip from the shorter timeframes.
Tokenomics and Holder Concentration
Holder data shows real concentration at the top, visible on the Etherscan token contract page. Total holder counts differ by source. CoinMarketCap lists roughly 3.08 million holders, while Etherscan's own count sits near 1,649,042. Anyone sizing a position should check both.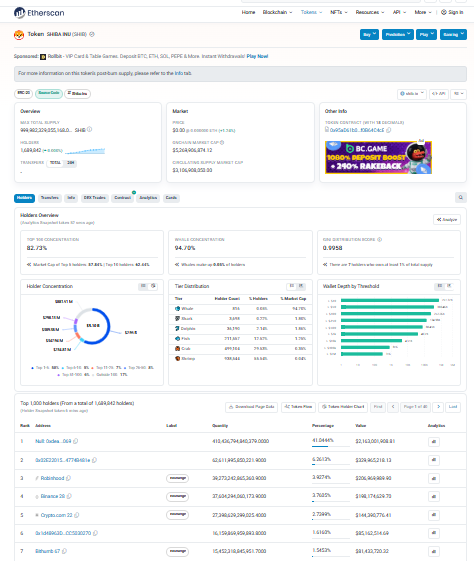
Concentration is severe. The top ten holders control 82.73% of tracked supply. Whale concentration reads at 94.78%, meaning nearly all supply sits with large wallets.
But raw numbers hide part of the real story here. The single largest wallet, holding over 412 trillion tokens, roughly 41% of the total supply, is a burn or reserve address rather than an active whale.
Past that, the picture shifts. Robinhood's custody wallet holds close to 6.26%, Binance's cold wallet sits near 3.42%, and Crypto.com holds around 2.8%. These are exchange custody wallets holding tokens for many retail users, not one accumulating party.
Does that leave much real, unaccounted concentration risk? Not as much as the headline numbers suggest, though it's not zero either.
Liquidity and Exchange Volume
Liquidity relative to market cap sits at just 0.14%, thin for a token this size, and volume spreads across nine venues rather than concentrating in one.
LBank leads the heatmap, with OKX and MEXC trailing close behind.
Volume By Exchange
Exchange | 24H Volume |
LBank | $8.27M |
OKX | $6.96M |
MEXC | $4.29M |
Bitget | $3.10M |
Coinbase | $1.59M |
Bitunix | $1.53M |
KuCoin | $1.22M |
Gate | $1.17M |
WhiteBIT | $901.44K |
Spread liquidity like this across nine venues usually means no single exchange is driving the price alone, a pattern echoed in the recent 361 billion SHIB exit Korea report on shifting regional flows.
Bull, Base, and Bear Scenarios
None of this is financial advice. These are scenario estimates built from the current chart structure, not guarantees.
Bull Case: A daily close above $0.00000622 opens a path toward $0.00000758 within 7 to 14 days. Probability is roughly 30%, contingent on volume returning alongside the price gain. Invalidation: a daily close below $0.00000480.
Base Case: Price continues coiling roughly between $0.00000480 and $0.00000622 over the next 7 to 30 days while the channel decides its next move, in line with the pattern covered in bulls taking control outflows stabilize. Probability is highest, around 45%. Invalidation: a clean break outside either boundary on rising volume.
Bear Case: The channel breaks downward, and the price retests the support zone near $0.00000409, with a deeper move toward $0.00000405 possible within 30 days if sentiment turns weak. Probability is roughly 25%. Invalidation: sustained trading above $0.00000560 for more than a week.
Price Forecast Table
Timeframe | Bear | Base | Bull |
24H | $0.0000051 | $0.0000053 | $0.0000056 |
7D | $0.0000048 | $0.0000055 | $0.0000062 |
30D | $0.0000040 | $0.0000058 | $0.0000075 |
Long Term (2026) | $0.0000030 | $0.0000070 | $0.0000120 |
These ranges are built around the support and resistance levels already on the chart, not certainties.
Key Risks
Falling volume alongside a price gain tops the list. It's a mixed signal that can flip either way without warning.
Whale concentration remains a long-term structural concern, even with much of it traced to burn addresses and exchange custody rather than lone accumulators.
Liquidity relative to market cap is thin at 0.14%, which can make moves in either direction sharper than usual.
Sector-wide swings can override any single token's chart setup, so this pattern is worth reading alongside broader crypto price action, including the case laid out in why this setup could define-month, rather than in isolation.
Disclaimer: This article is for informational purposes only and does not constitute financial, investment, or trading advice. Cryptocurrency markets are highly volatile. Readers should conduct independent research and consult a licensed financial advisor before making any investment decisions.









.jpg)








