Shiba Inu Price Prediction: Bulls Take Control As Outflows Stabilize


This Shiba Inu Price Prediction looks at where $SHIB stands today.
Shiba Inu launched in 2020 as a decentralized meme token and has since grown into one of the most widely held assets in the market, currently ranked #32 by market cap.
Right now, the Shiba Inu price today is $0.00000545, up 1.1% on the day. Market cap sits at $3.215B, with $69.979M changing hands over the past 24 hours.
Shiba Inu Coin Live Market Data
Metric | Value |
Price | $0.00000545 |
Market Cap | $3.215B |
Fully Diluted Valuation | $3.216B |
24-Hour Trading Vol | $69.979M |
Circulating Supply | 589.239T |
Total Supply | 589.496T |
Source: Shiba Inu Coin market data taken from CoinGecko, as of Sep 09, 2026. Figures may vary slightly across other tracking websites.
Liquidation Snapshot
Timeframe | Total Liquidated | Longs | Shorts |
1h | $130.34 | $0 | $130.34 |
4h | $7.84K | $16.04 | $7.82K |
12h | $8.41K | $588.36 | $7.82K |
24h | $47.47K | $39.20K | $8.27K |
Source: Liquidation Data Taken From CoinGlass , As of Sept 9, 2026
Shorts have taken the bulk of the damage over the past hour and four hours, a sign that sellers got caught out as $SHIB pushed up toward channel resistance.
Zoom out to 24 hours, though, and longs make up the larger share, closer to 83% of the total, reflecting an earlier stretch where leveraged buyers had it tougher.
Exchange Volume
LBank leads SHIB's futures activity at $14.69M over the past 24 hours, with OKX close behind at $11.91M. MEXC follows at $4.86M, while Bitget adds $3.28M. 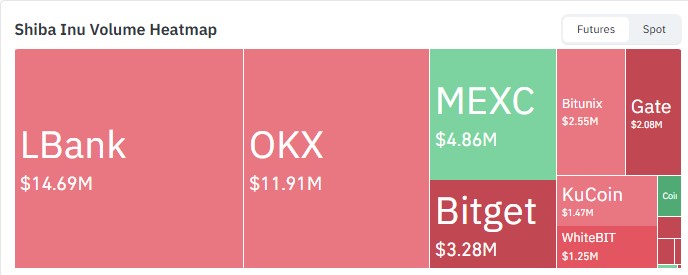
Source: Volume Heatmap Data Taken From CoinGlass , As of Sept 9, 2026.
Smaller volumes are flowing through Bitunix, Gate, KuCoin, and WhiteBIT, rounding out a fairly thin but broadly spread mix of trading activity.
Shiba Inu News: What's Driving Today's Move
Burn Activity Picks Up, Though the Rate Is Cooling
Shibburn reported that 8,187,519 $SHIB was burned over the past 24 hours, worth roughly $44.58 at current prices. 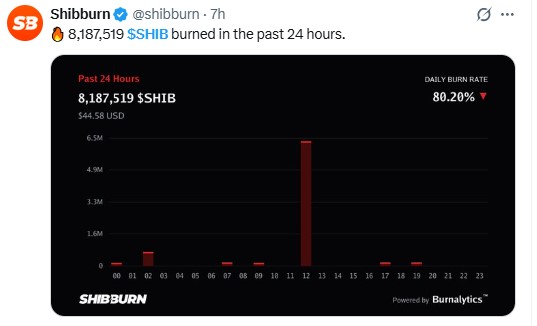
Source: Data Taken From @shibburn , X Account, as of Sep 9, 2026
That said, the daily burn rate itself was down 80.20% from the prior period, so while burning is still happening, today's pace looks more like a lull than a fresh acceleration.
Exchange Outflows Show Signs Of Stabilizing
U.Today reported that SHIB's market dynamic is improving as exchange outflows finally stabilize, noting that 311 billion in SHIB changed hands over 24 hours.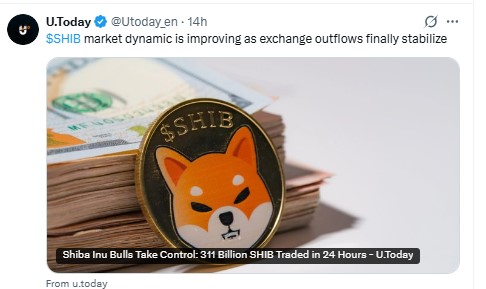
Source: Data Taken From @Utoday_en , X Account, as of Sep 9, 2026
Stabilizing outflows are generally read as a sign that selling pressure from exchange wallets has eased, which lines up with the more balanced tone in this week's price action.
Shiba Inu Price Prediction 2026: Technical Outlook
Pull up the hourly SHIB/USDT chart on Binance, and the story since September 7 has been a steady grind lower; the price has been boxed inside a descending channel the whole way down. 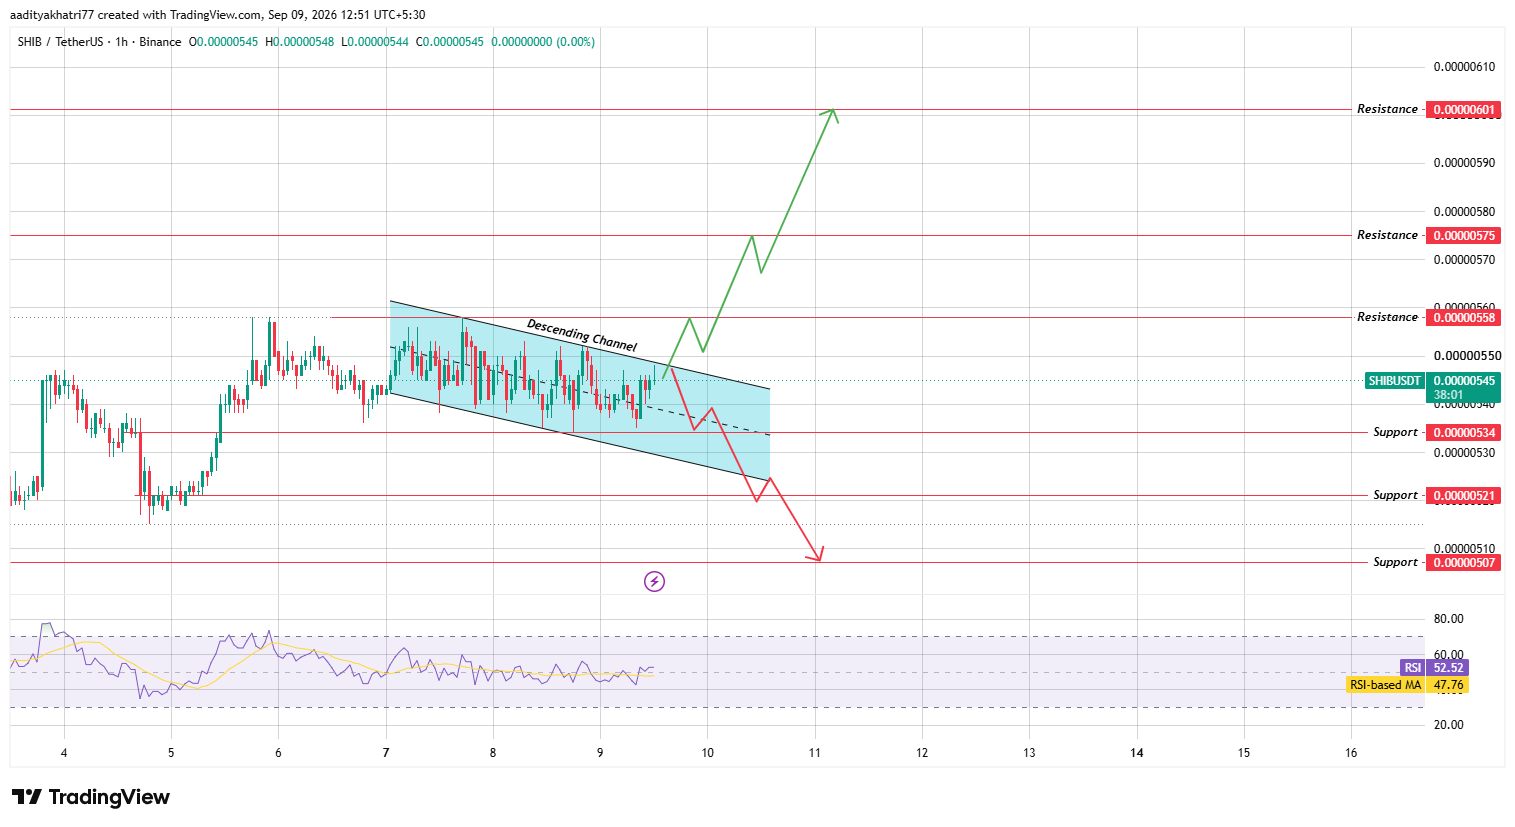
Source: Chart Taken From TradingView , as of Sep 9, 2026
Right now it's knocking on the channel's upper boundary. RSI is sitting at 52.52, just above its moving average of 47.76, a small tick up in momentum, though not quite enough yet to call it a confirmed reversal.
Could $SHIB Break Toward Higher Resistance?
If $SHIB clears the descending channel's upper boundary with a strong hourly close and rising volume, the first level becomes $0.00000558.
Clearing that on continued strength opens the path to $0.00000575, with $0.00000601 as the next resistance if buying pressure extends further.
What Happens If $SHIB Gets Rejected at the Boundary?
If instead the price gets turned away here and slides back down through channel support, the first level to watch is $0.00000534.
A failure to hold that could send SHIB toward $0.00000521, and continued selling would put $0.00000507 in view.
Support and Resistance Levels
| Support | Resistance |
| $0.00000534 | $0.00000558 |
| $0.00000521 | $0.00000575 |
| $0.00000507 | $0.00000601 |
Bull, Base, and Bear Scenarios
Scenario | Setup | Level |
Bull | Break the above channel resistance on volume. | $0.00000558–$0.00000601 |
Base | Price consolidates near channel resistance | $0.00000540–$0.00000560 |
Bear | Rejection from resistance, break of channel support | $0.00000534–$0.00000507 |
Glossary
Picture two parallel lines sloping downward, with price boxed in between them; that's a descending channel, and testing the upper line repeatedly is often the setup right before either a breakout or another rejection.
RSI tracks how fast and how far price has moved recently, which is why traders lean on it to judge whether momentum is building or fading before the price chart makes it obvious.
Liquidation happens when an exchange force-closes a leveraged position once a trader's margin runs out, and it tends to cluster around sharp moves that catch one side of the market off guard.
Support and resistance are simply the zones where buying or selling pressure has shown up strongly enough before to pause or reverse a move.
Shiba Inu vs Bitcoin
SHIB's price behavior still leans heavily on the broader market's direction, and Bitcoin's mood plays a real role in how this channel test plays out.
When Bitcoin trades with more conviction in either direction, thinner-liquidity tokens like $SHIB tend to see amplified reactions around key levels like the ones in play here.
Expert Opinion
Traders following SHIB's setup keep coming back to the same point: outflows stabilizing while price keeps knocking on resistance usually means sellers are starting to lose their grip, even if that's not the same thing as a guaranteed breakout.
As for the burn rate cooling off today, most seem to treat that as a footnote rather than a real story; the outflow trend is what's actually shifting the tone here.
Where $SHIB goes from this point probably comes down to the next few hourly candles more than either of these two data points on their own.
Disclaimer: This Shiba Inu price prediction is for informational purposes only and should not be treated as financial advice. Cryptocurrency markets are highly volatile, technical patterns can fail to play out as expected, and any of the scenarios described above carry a realistic probability of not occurring. Readers should conduct independent research before making any investment decisions.
Also read:

















