Silver Price Prediction October 2026: Can XAG/USD Reach $121


Silver price prediction October 2026 chatter is getting louder, and today's sharp drop is the reason. The metal took a hard hit right as bond markets started flexing, and traders are now asking whether this is a bargain or a warning. The chart has a surprisingly clear answer to what matters next. Here is the full story.
Editorial note: our desk holds no personal position in silver. This is purely a chart and data read.
Silver Price Today: Live XAG/USD Data
Silver is trading at 61.020, down 3.094, or 4.83%, on the day. The session opened at 64.114 and never got back there, touching a low of 60.816 along the way.
That is a heavy daily candle for a metal that was holding near 64 only a few sessions ago. To see how a similar trendline setup looks in crypto, read our Bitcoin price outlook this week.
Source: TradingView, XAG/USD, 1D, FXCM, Sep 28, 2026, 13:46 UTC+5:30
Silver News Today: Bond Yields Drag Precious Metals Lower
What the Post Says
Peter Schiff (@PeterSchiff) posted that gold and silver are once again being pulled down by rising bond yields. 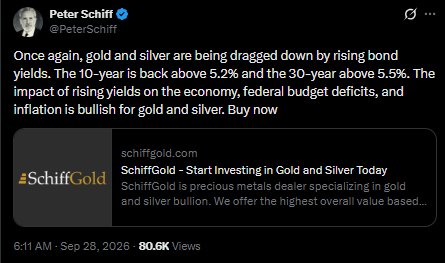
He points to the 10-year Treasury yield back above 5.2% and the 30-year above 5.5%.
Why Yields Hurt Silver Right Now
Silver pays no interest. When Treasury yields climb, holding a bar of metal costs more in missed income, so money drifts toward bonds. That is the mechanism behind today's slide.
The Bullish Argument He Makes
Schiff argues that the same yield spike is bullish over time because higher borrowing costs strain the economy and federal budget deficits while feeding inflation, all of which historically support precious metals. His call is simply to buy now.
How to Read It
The post links to SchiffGold, a precious metals dealer, so the buy call is an opinion from an outspoken metals supporter, not neutral analysis. The yield numbers are the useful part. For more on this theme, see our best inflation hedge assets guide.
Source: Peter Schiff (@PeterSchiff) X post, Sep 28, 2026, 6:11 AM
US Dollar Impact on Silver: What Could Happen Next
Silver is priced in dollars, so a stronger greenback makes the metal more expensive for everyone else and usually caps demand. That is exactly the pressure showing up lately.
XAG was pushed lower last week by a stronger dollar and surging Treasury yields, with the 10-year and 30-year yields hitting their highest levels since 2007 and 2004, while the dollar reached a near two-month high.
The dollar index later slipped below 101, pausing a five-session rally that had lifted it to July highs. Traders following the greenback can also check our US dollar index forecast. TRADING ECONOMICS.
What can happen from here depends on which way the dollar breaks. If it resumes climbing alongside yields, silver could keep sliding toward 54.598 and possibly the 50 area.
If the dollar loses steam, silver has room to bounce back through the top of its descending channel. The Fed's preferred inflation gauge and key US jobs data are both due this week, so volatility is likely.
Global Sentiment and Silver
Sentiment right now leans cautious and rate-driven. The Fed delivered its first rate hike in three years last week and signaled more could follow, with traders pricing nearly a 70% chance of another hike in October.
Strong US business activity data has kept that tightening talk alive. Higher rates are a headwind for any asset that pays nothing. TRADING ECONOMICS
There is one softer note. US and Iranian negotiators were reportedly exploring a deal to reopen the Strait of Hormuz, which has eased some oil-driven inflation worries.
If that progress holds, rate-hike fears could cool, and that would be a relief for silver. If talks stall, expect the opposite.
Quick Take
CMP: 61.020 (daily chart, FXCM)
Bullish trigger: daily close above 71.162
Failure level: daily close below 45.662
Data timestamp: Sep 28, 2026, 13:46 UTC+5:30
Risk note: a dip toward 50 is possible before any recovery.
Silver Price Prediction October 2026 Technical Analysis
Zoom out and silver tells a longer story than the last few red candles suggest. The metal bottomed near 45.662 in late 2025, then ripped higher in one of the steepest advances on the chart and topped out near 121.598 in early 2026. 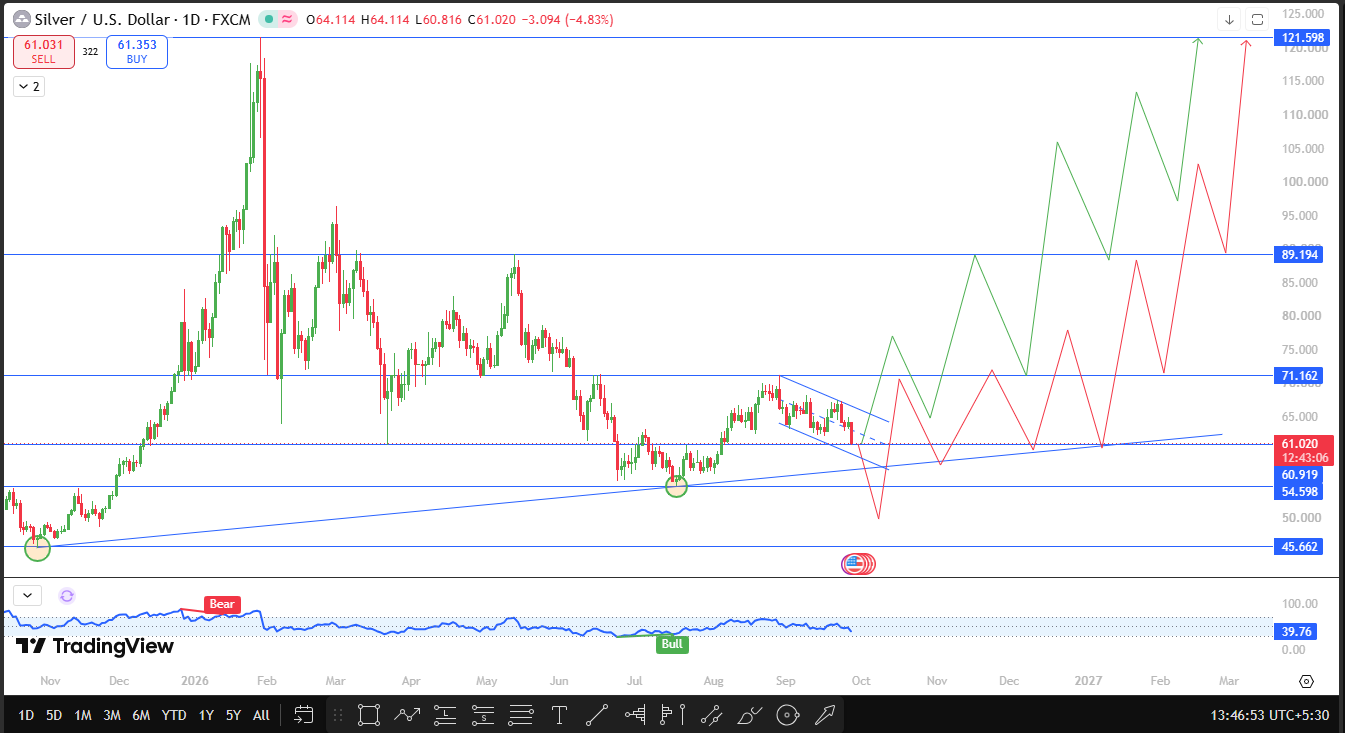
What followed was a slow correction, with a lower high near 89.194 in May and a slide into July that carried the price down to a rising trendline drawn from that late-2025 low.
That July touch is the important one. The trendline held, the oscillator printed a bullish divergence label right there, and silver bounced to the 71.162 area. Since then the price has drifted lower inside a descending channel, and today's drop brought it back to 61.020, right on the trendline and the 60.919 level.
Price is testing the same support again, only now with the channel pressing down from above.
The oscillator reads 39.76, low in its range, which fits a market that has been sold hard. A low reading does not promise a bounce, but it shows sellers have already done plenty of work.
The bullish shift needs a daily close above 71.162. That level capped the last recovery, so a close above it would turn the bigger picture from bearish to bullish. The next resistance is then 89.194, with 121.598 as the extended target.
The chart also allows for pain first. A deeper pullback toward 54.598 or the 50 area would not break the long-term structure by itself. A daily close below 45.662 is where the setup becomes invalid, since that would erase the whole rally from the late-2025 low.
Source: TradingView, XAG/USD, 1D, FXCM, Sep 28, 2026, 13:46 UTC+5:30
Silver Support and Resistance Levels
Level | Type | Distance from CMP (61.020) |
121.598 | Extended resistance | +99.28% |
89.194 | Next resistance | +46.17% |
71.162 | Structure change trigger | +16.62% |
60.919 | Trendline support zone | -0.17% |
54.598 | Deeper support | -10.52% |
50.000 | Deep pullback zone | -18.06% |
45.662 | Invalidation level | -25.17% |
Bull, Base, and Bear Scenarios for Silver
Bull case. Silver defends the trendline, breaks out of the descending channel, and eventually closes above 71.162 on the daily chart.
A cooler dollar and calmer yields would help that along. From there, 89.194 is the first big target, and 121.598 sits far above as the long-range goal.
Base case. Price keeps bouncing inside the channel around the trendline while the market waits on inflation and jobs data. With yields and the dollar still firm, a choppy grind between 54.598 and 71.162 is the most likely near-term outcome.
Bear case. The trendline gives way, and sellers push silver toward 54.598, then the 50 zone. That would hurt, but the long-term structure survives as long as the price stays above 45.662. A daily close under that level ends the bullish idea completely.
Risks to Watch
Silver moves fast, and a 4.83% daily drop shows how quickly sentiment can flip. A hotter inflation print or a strong jobs report could push yields and the dollar higher again.
Fed hike expectations are already elevated, so any surprise cuts both ways. The Schiff post is opinion, and geopolitical headlines around oil can change the picture overnight.
Glossary
Descending channel: two downward-sloping parallel lines that contain price.
Bullish divergence: price makes a lower low while momentum turns up.
Disclaimer
This article is for educational and informational purposes only and is not financial advice. Commodity and crypto markets are highly volatile. Do your own research before making any trading decision.

















