Could Silver Hit $500? Long-Term Silver Price Forecast 2030-2050


Silver has quietly reached a point on the weekly chart that very few people expected it to test this soon, and the reaction from the wider trading community has been anything but quiet.
A multi-year descending trendline that has capped every rally attempt since the last major top is now being retested for a second time, and this time price is not folding the way it did before.
The silver price forecast (XAGUSD) conversation) has suddenly shifted from short-term trading levels to something much bigger, long-range targets that stretch all the way out to 2030, 2035, 2040, and even 2050.
What is fueling that shift is not just the chart itself; it is a growing number of voices in the commodities space suggesting that silver's real story might only be getting started.
This is a technical and sentiment-based read of the silver chart and current market commentary. It reflects no personal position in XAG and should not be treated as financial advice.
Silver Price Chart Snapshot
Silver is currently trading at $66.177 on the weekly XAG/USD chart, up 3.07% on the week after opening at $64.208 and touching a weekly high of $67.178.
This move comes directly into contact with a descending trendline connecting the metal's prior swing highs, a structure that has repeatedly turned rallies back over recent quarters.
The fact that the price is holding near this trendline rather than immediately rejecting lower is exactly why the silver price prediction conversation has picked up so much energy this week.
Source: weekly XAG/USD chart, September 19, 2026.
Silver Price News Today
The bigger driver behind this renewed silver price forecast enthusiasm is not the chart alone; it is commentary coming out of the commodities analysis space.
In an interview published in mid-September 2026, a veteran technical analyst who has tracked metal markets for decades revisited his own long-standing silver targets.
He explained that he had previously floated multi-hundred-dollar targets for silver and later pulled them back, not because he no longer believed silver could reach that range, but because he had become less confident that the move would actually stop there once it got going.
He went further, suggesting that traders holding long-term short positions against silver could end up facing serious losses if the structural move he is describing plays out as expected, essentially arguing that price will not stop before the $500 mark.
Commentary like this does not change the chart itself, but it does add a compelling long-term narrative sitting right behind the current technical setup.
Source: commodities-focused interview, September 12, 2026.
Quick Take
CMP: $66.177 on the weekly Silver/USD chart
Structure: silver fell away from a descending trendline earlier this year and is now retesting it for the second time
Momentum: three weeks of selling were followed by a green weekly close, and price is currently sustaining right at the trendline
Bullish trigger: sustained weekly close above the trendline near $89.194 opens the path to $121.598, then $150.000
Bearish trigger: a break below 54.791 could grab liquidity first and then attract aggressive buying rather than confirming a clean breakdown
Long-term note: some analysts argue silver's eventual ceiling could sit well beyond $500, though this is a multi-year thesis, not a near-term trading level
Silver Technical Analysis: XAGUSD Long-Term Outlook
Zooming into the weekly silver chart, the structure is fairly striking once you see it clearly.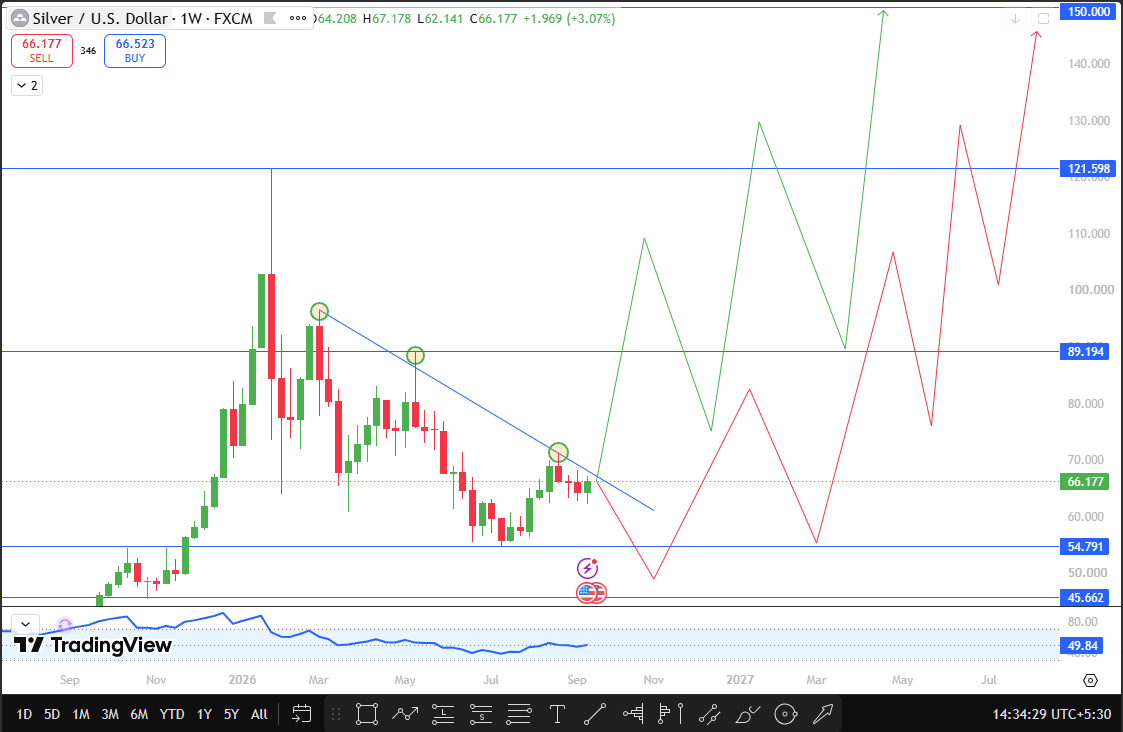
Silver had been falling steadily away from its descending trendline for months, and this current move actually marks the second time price has come back up to retest that same line.
The first test earlier in this downtrend failed to hold, but the character of this second attempt looks different.
Price spent three consecutive weeks under selling pressure as it approached the trendline again, the kind of grinding decline that often exhausts sellers rather than strengthens them, and then last week produced a clean green weekly close right at the line itself.
That shift from three red weeks straight into a green close at a major resistance structure is exactly the kind of behavior technical traders watch for when a trend is starting to lose its grip.
The weekly momentum oscillator is currently reading close to 49.84, sitting almost exactly at the neutral midpoint.
That is actually a meaningful detail, because it shows XAG is not stretched or overbought heading into this second retest, which leaves plenty of room for momentum to build if buyers manage to sustain control here.
A confirmed weekly close above this trendline, especially on the back of a second successful test rather than a first attempt, would be a stronger technical signal than usual that the multi-year downtrend has genuinely broken, and it is that confirmation that would set the stage for the longer-term silver price prediction targets discussed further below.
On the other side of this setup, $54.791 is worth watching carefully, but not necessarily as a simple bearish trigger.
A break below that level could function as a liquidity grab, a move that sweeps through resting stop losses and short-term sell orders before reversing sharply, and if that plays out here, it could actually bring in a wave of aggressive buying rather than confirming a straightforward breakdown.
Traders should watch how price behaves immediately after any dip below $54.791 rather than assuming it automatically means the downtrend has resumed.
Silver Support and Resistance Levels
Level Type | Price | Distance from CMP (66.177) |
Resistance 3 | $150.000 | +126.7% |
Resistance 2 | $121.598 | +83.8% |
Resistance 1 | $89.194 | +34.8% |
Current Price | $66.177 | — |
Support 1 (possible liquidity grab zone) | $54.791 | -17.2% |
Support 2 | $45.662 | -31.0% |
Silver Price Prediction 2030
Looking out toward 2030, the most reasonable technical target for silver builds directly off the current trendline structure.
If the second retest of the trendline holds and a confirmed breakout follows, $89.194 becomes a realistic medium-term milestone, representing the kind of gradual, structural climb that tends to unfold once a multi-year downtrend finally reverses after a successful retest.
This is not a target built on hype; it is simply the next visible resistance shelf that a confirmed breakout would likely work toward over a several-year horizon.
Silver Price Prediction 2035
By the time the mid-2030s roll around, the picture becomes more ambitious if the broader bullish thesis continues to play out.
A move toward $121.598 would represent a substantial extension from current levels, and reaching it would likely require silver to establish a genuinely new long-term uptrend supported by sustained demand, rather than a single sharp rally.
This is where the technical chart and the more bullish commentary from analysts start to overlap, since a move of this size is consistent with the kind of structural change that commentators pointing toward much higher long-term prices tend to describe.
Silver Price Prediction 2040
Pushing out to 2040, the chart's furthest visible resistance near $150.000 comes into view as a long-range XAGUSD price target.
Getting there would mean silver has spent over a decade in a genuine bull structure following this trendline break, absorbing multiple cycles of consolidation and advance along the way, including any volatility from liquidity grabs like the one that could occur near $54.791 in the near term.
It is worth being honest here: a forecast this far out carries significant uncertainty, but it does align with the general direction that longer-term commodities bulls have been describing in recent interviews and commentary.
Silver Price Prediction 2050
The 2050 outlook is where this XAG price forecast moves from pure chart-based projection into more speculative, thesis-driven territory.
Some experienced commodities analysts have gone as far as suggesting that silver's eventual ceiling in a genuine long-term bull cycle may sit well beyond $500, arguing that once such a structural move truly gets underway, it tends to travel further than most participants initially expect.
This kind of thinking is grounded in decades of historical precedent around commodity cycles rather than any single technical level, and it should be treated as a long-range opinion rather than a guaranteed outcome.
Even so, it gives readers a sense of just how large some serious voices in the space believe this cycle could ultimately become.
Risks to the Silver Price Forecast
Long-term forecasts stretching out to 2040 and 2050 inherently carry a wide margin of uncertainty, since they depend on macroeconomic conditions, industrial demand, and monetary policy shifts that are impossible to predict with precision over such a long horizon.
The second trendline retest happening right now could also simply fail despite last week's green close, sending XAG back into its prior downtrend rather than confirming a genuine reversal.
A potential liquidity grab below $54.791 is a plausible outcome based on the structure, but it is not guaranteed, and a break there could just as easily continue lower without reversing.
Analyst commentary describing targets in the hundreds of dollars should be understood as one experienced perspective among many, not a certainty, and readers should weigh it accordingly against their own research and risk tolerance.
Glossary
Descending trendline: A line connecting a series of lower highs, often used to identify resistance during a downtrend.
Trendline retest: A second or subsequent attempt by price to reach a previously broken or tested trendline, often viewed as a stronger signal than a first attempt.
Liquidity grab: A sharp move through a key level that triggers nearby stop losses or resting orders before reversing in the opposite direction.
Weekly close: The final price at which an asset trades before the weekly candle finishes, commonly used to confirm major long-term breakouts.
Disclaimer
This article is for informational purposes only and does not constitute financial advice. Long-term price targets, including those referencing analyst commentary, are opinions and forecasts, not guarantees. Commodity and precious metals markets are highly volatile, and readers should conduct their own research before making any investment decisions.


















