Solana Price Prediction: SOL Users Hit All-Time High, Why Price Down?


Solana just Hit an all-time high in daily active users while its tokenised commodities market explodes, even as price pulls back inside its own rising channel.
This Solana price prediction looks at whether $110.00 holds and SOL sets up another run at $150.
Why Is SOL Down Today?
SOL was down 3.18%, and the Solana price today is trading at $113.17 over 24 hours, closely tracking a broader market pullback tied to macro-driven risk reassessment, with a near-identical beta to Bitcoin's 2.87% decline, suggesting the move was market-wide rather than Solana-specific.
The primary driver was hawkish Fed signals and rising Treasury yields triggering a risk-off move across crypto, with secondary pressure from a technical retracement after a strong weekly rally and unwinding of leveraged long positions.
Solana News: Daily Active Users Hit an All-Time High
A social media post from Solana Sensei said Solana's total daily active users hit an all-time high, recording over 8 million users in a single day.
CoinGabbar could not independently verify this figure, as no on-chain dashboard was linked alongside the claim.
Solana News Today: Tokenised Commodities See Explosive Growth
SolanaFloor reported that after tokenised stocks, tokenised commodities are now seeing explosive growth on Solana, with weekly volume hitting $87M last week as Solana's share of that volume across all chains rose from 5% to a record 30% in just seven weeks, with Raydium capturing 70% of Solana's share.
A chart shared alongside the post broke down the wider market, showing Robinhood at 38%, Solana at 30%, and Ethereum at 21% of tokenised commodities spot volume.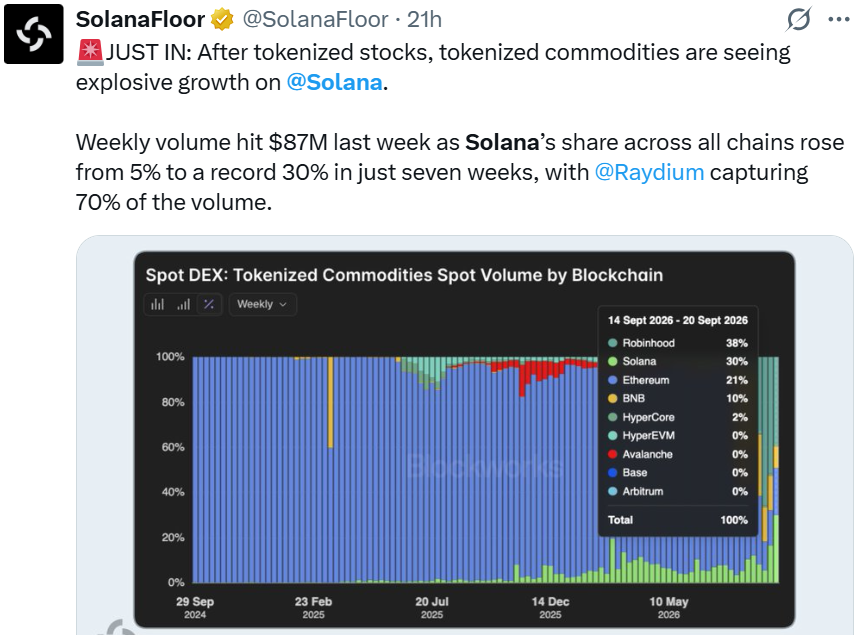
CoinGabbar could not independently verify the exact figures, as no primary data source was linked beyond the chart shown.
SOL Technical Analysis
SOL has been climbing steadily inside an ascending channel since early August, making a fresh high above $120 in the past few sessions before pulling back to $113.17 today.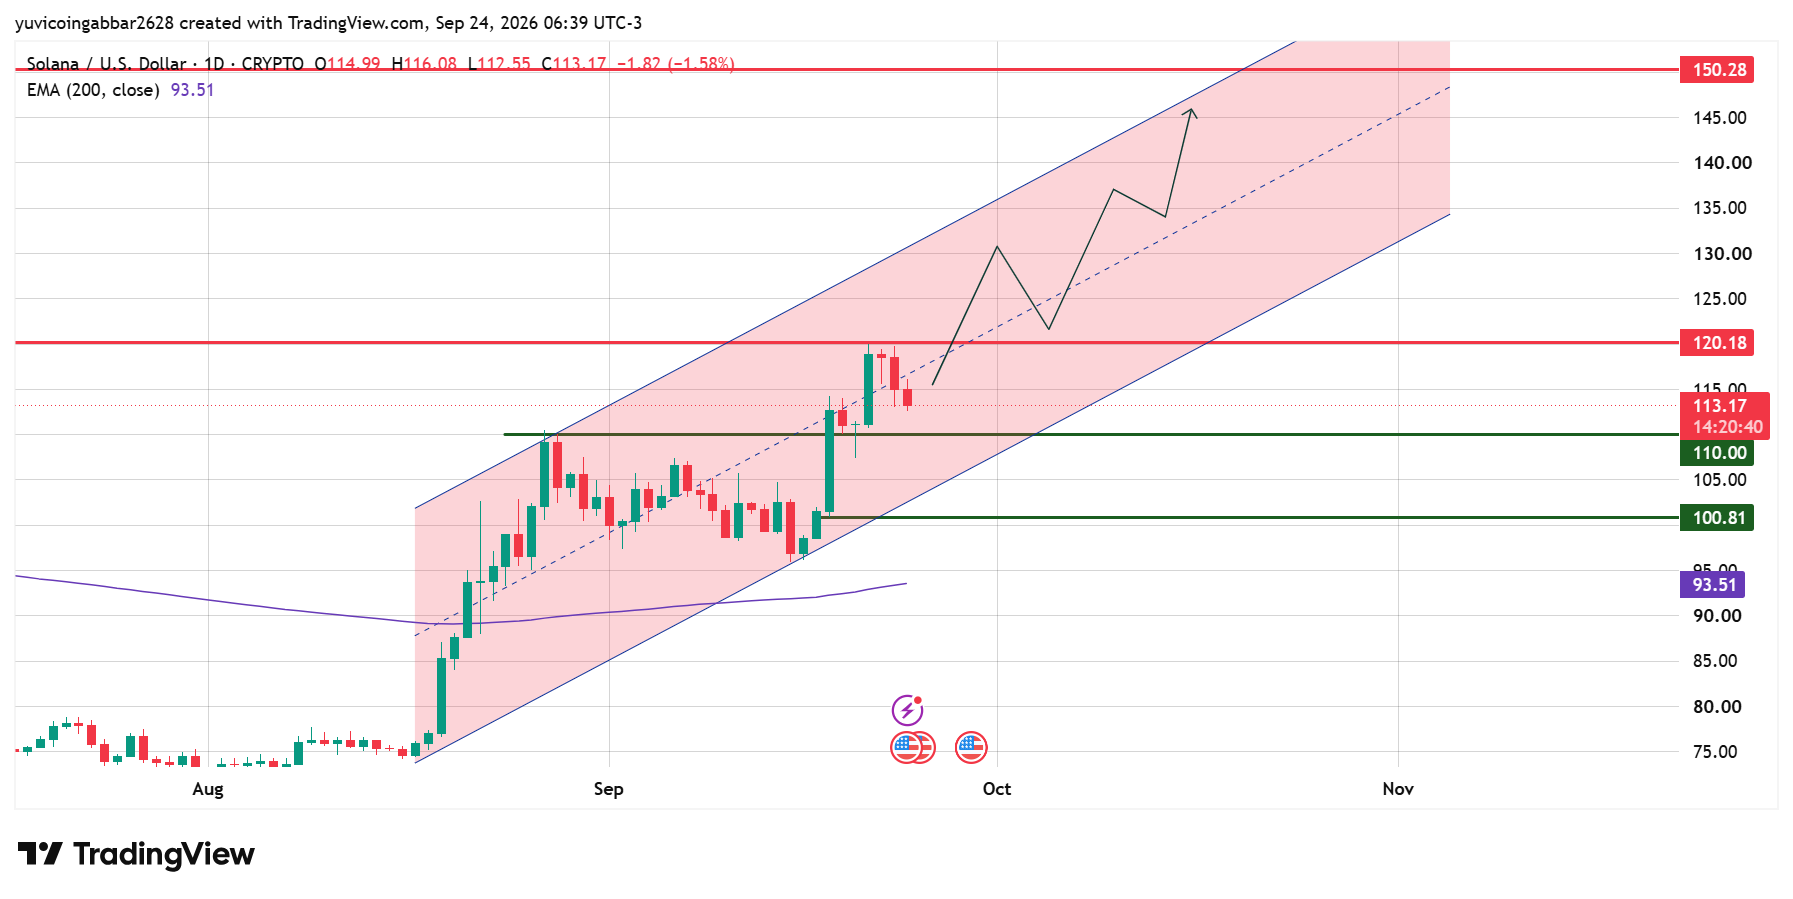
The 200 EMA ($93.51) sits well below the Solana current price at $113.17, confirming the longer-term uptrend is intact, while the $110.00 level marks the nearest support inside the channel after the recent breakout.
Solana Outlook: Key Levels
Level Type | Price |
Resistance 2 (channel top) | $150.28 |
Resistance 1 | $120.18 |
Immediate Price Reference | $113.17 |
First Confirmed Support | $110.00 |
Deeper Support | $100.81 |
EMA 200 | $93.51 |
Solana Price Forecast
Bull case: Holding above $110.00 keeps the ascending channel intact, and a confirmed close above $120.18 would open the path toward $150.28.
Record daily active users and rapid tokenised commodity growth both point to real usage backing the price trend, not just speculation.
Bear case: A close below $110.00 would risk a deeper pullback toward $100.81, and losing that level would put the channel structure itself in question after such a sharp August-to-September run.
Solana Price Prediction: Can SOL Reach $150.28?
$150.28 marks the top of the ascending channel on the chart. Reaching it would require SOL to first clear $120.18 and stay inside the channel, a move that would likely need continued user growth and tokenised asset volume rather than a single rally.
Solana Price Prediction 2026: Expert View
According to CoinGabbar analysts, an all-time high in daily active users alongside a fast-growing tokenised commodities market gives this rally a usage-driven backbone that a lot of chart breakouts don't have.
The pullback to $113.17 looks like normal channel behaviour so far, but $110.00 is the level that confirms whether the structure since August is still intact.
Disclaimer
This piece is for informational purposes only and isn't financial advice. The levels and scenarios above are based on technical chart analysis and publicly available data at the time of writing, and crypto markets can move sharply within hours, so past patterns don't guarantee future outcomes. It's worth doing independent research and considering your own risk tolerance before acting on any of the levels discussed here.

















