Solana (SOL) Price Prediction: Analyst Eyes $160 as Bull Flag Forms

Solana rose more than 6% to trade above $105 on September 18, leading gains in a broader crypto market rally that pushed total market value near $2.66 trillion, up 2.12% on the day.
The move puts SOL at a key technical level. Chart analysts are watching for a close above $105 to confirm a bull flag breakout, a pattern that could open the door to $130.
This Solana price prediction examines the technical setup, on-chain data, and macro backdrop shaping the current move.
Solana Rallies as Global Rate Moves Lift Crypto Market
The rally came despite, not because of, monetary policy. The Bank of Japan raised interest rates by 25 basis points to 1.25%, the highest level in roughly 31 years.
The U.S. Federal Reserve also raised rates this week, and the Clarity Act failed to pass Congress. Rate hikes typically pressure risk assets, including crypto.
Crypto markets moved higher anyway. Solana led the advance among major tokens.
Bull Flag Pattern Nears Breakout on 4-Hour Chart
Analyst Ali Charts identified a bull flag forming on Solana's 4-hour chart, with $105 marked as the level to watch.
A sustained close above that level would confirm the pattern, according to the analysis, with $130 cited as a potential target.
SOL traded at $105.58 at the time of writing, putting price action directly at that threshold.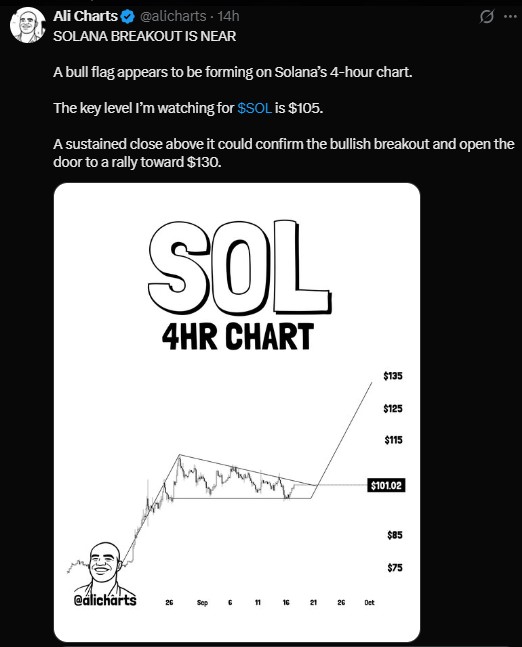
Daily Chart Shows Key Resistance Near $110
The daily chart shows a similar setup. SOL advanced from roughly $74 to $110 before entering a flag-shaped consolidation, with price now testing the upper boundary near $105.82.
Level Type | Price Zone | What It Means |
Resistance to break | $110 - $112 | Needed for daily breakout confirmation |
Upside target (measured move) | $145 - $150 | If breakout confirms |
Extended upside target | $155 - $160 | Longer stretch target |
Support | $100 | Losing this weakens the setup |
Invalidation level | $93 - $94 | Below this, bullish structure breaks down |
The Relative Strength Index sits near 60, a reading that leaves room for further gains without signaling overbought conditions.
Chart-based projections are not guarantees. A failure to clear resistance, or a break below support, would weaken the bullish case.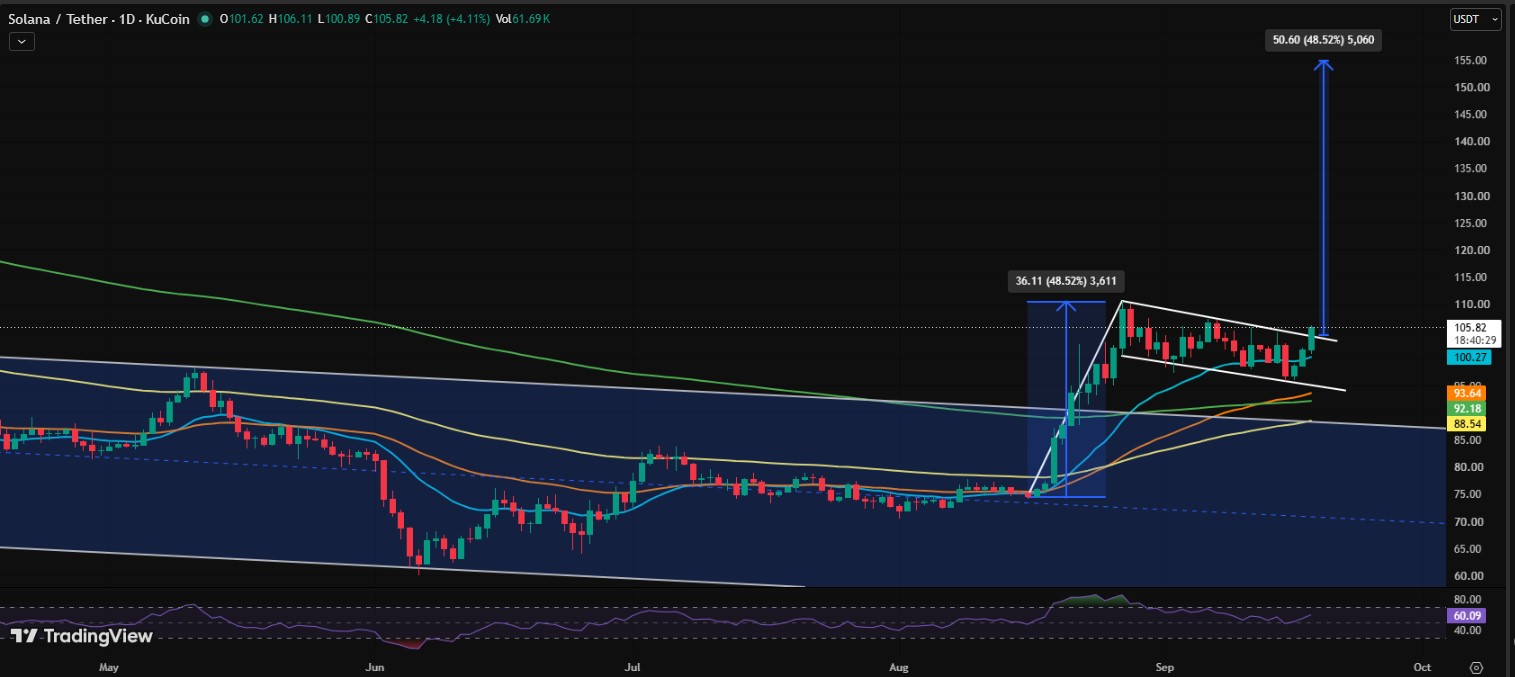
Weekly Chart Points to Long-Term Cup-and-Handle Setup
A broader pattern is visible on the weekly chart. Ali Charts pointed to a multi-year cup-and-handle formation with a neckline near $360, well above current price.
A confirmed breakout above that level, the analysis suggests, could support a longer-term move toward $1,300.
The setup is a multi-year scenario rather than a near-term forecast, and remains speculative given how far price would need to travel to test it.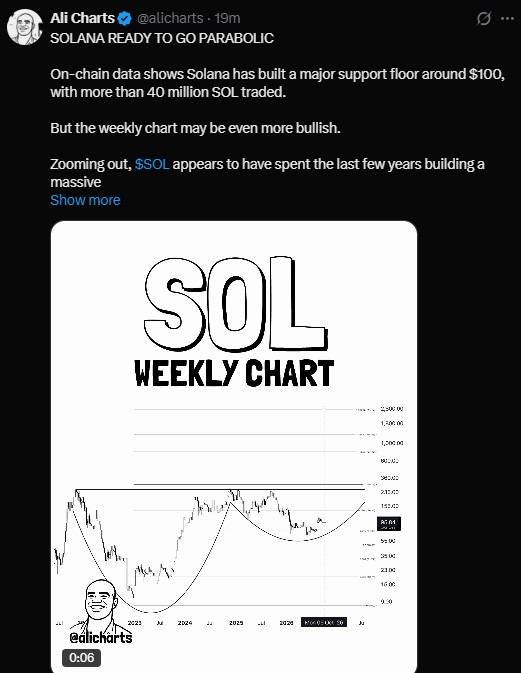
On-Chain Data Shows Support Building Near $100
On-chain data shows more than 40 million SOL has traded near the $100 level, pointing to a support floor building at that price.
Metric | Value | 24h Change |
Price | $105.58 | +6.01% |
Market Cap | $62.05B | - |
Futures Volume | $7.96B | +12.87% |
Open Interest | $6.20B | +5.19% |
Options Volume | $28.11M | +31.67% |
Long/Short Ratio | 1.028 | Balanced |
Total Liquidations | $21.38M | - |
Liquidations over the past 24 hours totaled $21.38 million, with short positions accounting for $19.99 million of that figure against $1.38 million in long liquidations. The imbalance suggests traders positioned against Solana were caught off guard by the rally.
ETF Inflows Go Flat for First Time
Not all signals were positive. SoSoValue data showed Solana's daily net ETF inflow at $0.00 on September 17, the first time the figure has been completely flat.
Cumulative net inflow remains at $1.37 billion, with total net assets of $1.42 billion, equal to roughly 2.39% of Solana's market capitalization.
A single flat day does not reverse the broader inflow trend, though continued stagnation would bear watching.
Risks That Could Derail the Bullish Case
Several factors could challenge the current setup:
A daily close below $100 would weaken the bullish structure
A drop below $93 to $94 would invalidate much of the pattern
Continued flat or negative ETF flows could signal cooling demand
A broader pullback across crypto markets could pressure SOL alongside peers
The long/short ratio of 1.028 indicates a relatively balanced market, not one skewed heavily toward bullish positioning.
The Bottom Line for Solana Traders
Solana faces a test at current levels. A confirmed close above $110 to $112 on the daily chart would open a path toward $145 to $160, based on the measured-move projection from the prior rally.
The weekly cup-and-handle pattern offers a longer-term bullish scenario, but the $360 neckline and $1,300 target remain distant markers rather than near-term expectations.
For now, the immediate question is whether SOL can hold above $100 and convert $105 from resistance into support.
Disclaimer
This article is for informational purposes only and does not constitute financial advice. Cryptocurrency markets are highly volatile and unpredictable. Prices can rise or fall sharply within short periods. Always do your own research and consult a licensed financial advisor before making any investment decisions. Past performance and chart patterns do not guarantee future results.




















