Silver Price Prediction: Oversold Bounce Could Push XAGUSD To $75


This silver price prediction looks at a market that has cooled off noticeably after a strong run higher, with price now boxed inside a falling channel that is testing the patience of both bulls and bears.
Here is exactly what the chart is showing, where the momentum indicator stands, and the levels that will decide silver's next real move.
Position disclosure: No personal position is held in silver or XAGUSD. This is a purely technical and data-based read of the chart, not financial advice.
Silver Price Today: Live Data
Silver opened the current session at $63.694, touched a high of $63.816 and a low of $63.518, before settling near $63.539, down $0.156, or 0.24%, on the hour.
That modest hourly loss sits inside a larger pullback from the recent swing high closer to $67, and the pace of the decline has slowed noticeably as price now grinds sideways to lower inside a defined channel rather than dropping in a straight line.
Source: TradingView, OANDA, September 24, 2026
Quick Take
CMP: $63.539 (1h chart)
Bullish trigger: close above $65.22049
Bearish trigger: close below $62.33447
Data snapshot: September 24, 2026
Risk note: momentum is already oversold at 25.89, so a bounce could happen even without a full trend reversal
Silver Price Prediction 2026 Technical Analysis
The 1h XAGUSD chart on OANDA shows silver rolling over from its recent highs near $67 and settling into a clean descending channel, with both the upper and lower boundaries sloping down in parallel.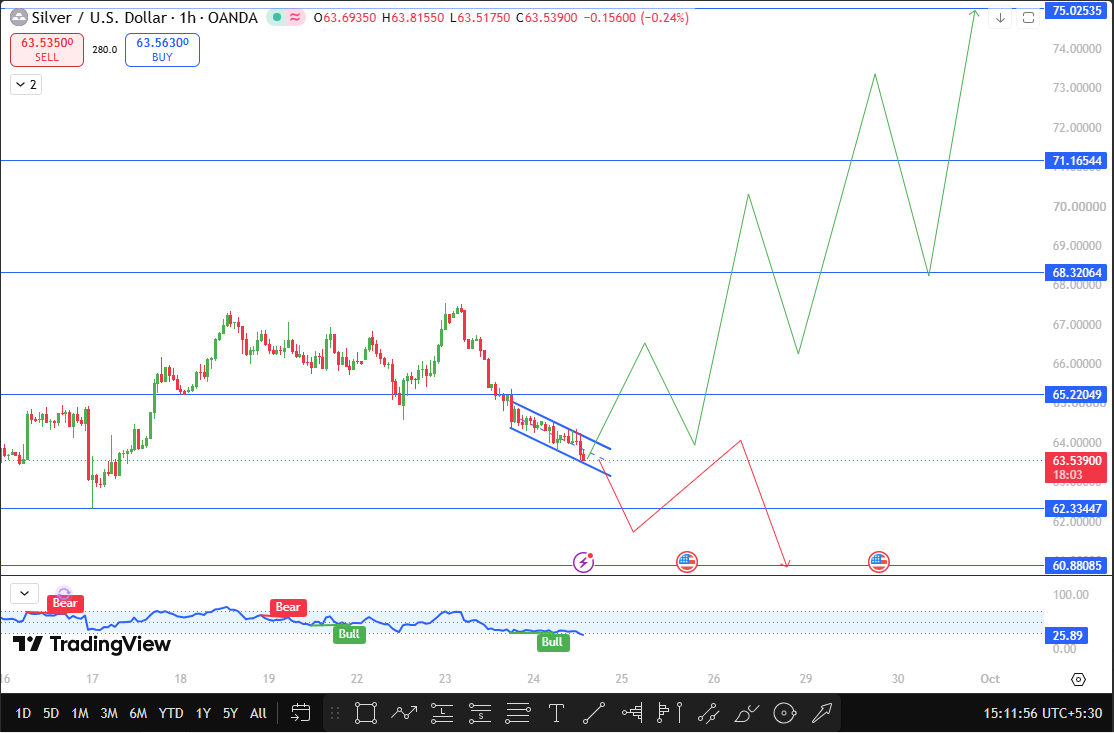 Price is currently trading near the lower edge of that channel, and the momentum indicator has dropped to 25.89, a level that typically flags an asset as oversold in the short term.
Interestingly, two Bull signals have already fired on this indicator during the recent decline, which suggests some buying interest is quietly building even as price keeps drifting lower within the channel.
For this silver price prediction, the immediate battle is at the channel's lower boundary.
A one-hour close below $62.33447 would confirm the channel is extending downward, and $60.88085 becomes the next realistic support target from there.
The more constructive scenario plays out if silver can break out of the top of this descending channel and close above $65.22049, which would suggest the pullback is losing steam.
That kind of breakout would put $68.32064 in focus first, followed by $71.16544, with $75.02535 standing out as the major long-term resistance if silver ever mounts a sustained recovery back toward its recent highs and beyond.
Chart: TradingView, Silver/U.S. Dollar, 1h OANDA, September 24, 2026
XAG Support and Resistance Levels
Level Type | Price | Distance from CMP |
Major Resistance | $75.02535 | +18.1% |
Resistance 3 | $71.16544 | +12.0% |
Resistance 2 | $68.32064 | +7.5% |
Resistance 1 | $65.22049 | +2.7% |
Current Price | $63.539 | — |
Support 1 | $62.33447 | -1.9% |
Support 2 | $60.88085 | -4.2% |
Bull, Base, and Bear Case
The bullish case for this XAGUSD price prediction has silver holding above the channel's lower boundary, momentum continuing to recover from oversold levels, and eventually a close above $65.22049, which would open a path toward $68.32064 and then $71.16544, with $75.02535 as the extended target if the move has real strength behind it.
The base case is silver continuing to drift inside the descending channel for now, oscillating between roughly $62.30 and $65.20 while the oversold reading and the channel structure fight for control.
The bear case shows up if $62.33447 breaks on a closing basis, confirming the channel is extending lower and putting $60.88085 in play as sellers stay in charge.
Risks to Watch
Silver's oversold momentum reading raises the odds of a short-term bounce, but oversold conditions can persist longer than expected in a strong downtrend, so this is not a standalone reversal signal.
Broader macro drivers, including US dollar strength, interest rate expectations, and industrial demand trends, tend to move XAG more than any single chart pattern, so this technical setup should be read alongside the wider macro backdrop rather than in isolation.
Silver Price 2030 Price Outlook
Looking further out, silver's medium to long-term trajectory will likely hinge on how global interest rate cycles evolve and how much industrial demand, particularly from solar and electronics manufacturing, continues to grow alongside its traditional role as a monetary metal.
If both of those demand drivers stay supportive while supply growth remains constrained, XAG has room to work meaningfully higher than current levels over the next several years, though near-term price action will keep swinging with broader risk sentiment along the way.
Glossary
Descending channel: A price pattern formed by two parallel, falling trendlines that contain price action within a downward-sloping range.
Oversold: A condition where a momentum indicator suggests an asset has fallen too far too fast, raising the odds of a short-term bounce.
Breakout: A decisive move beyond a chart pattern's boundary, often signaling the start of a fresh directional trend.
Support and resistance: Price levels where buying or selling pressure has historically been strong enough to pause or reverse a trend.
Disclaimer
This article is for informational purposes only and does not constitute financial advice. Commodity markets are volatile, and any trading or investment decisions should be made after conducting independent research.

















