Pi Network: Why Traders Are Watching PI at $0.088 Closely


Pi Network has spent the past several weeks building higher lows along a steady rising trendline, and the daily chart now shows price pressing directly against a resistance wall that has capped every recent attempt to move higher.
This pi network price prediction looks at whether buyers can finally force a breakout or whether the trendline that has held since July gives way instead.
Pi Network launched its mainnet after years of mobile mining through its app, positioning itself as an accessible entry point into crypto for millions of users who mined the token before it ever traded on exchanges.
Since then, price has moved through sharp swings, and the current setup marks one of the more closely watched technical tests in recent weeks.
The Pi Network price today is $0.08241, down 0.9% over the past 24 hours.
The 24-hour range has held between $0.08087 and $0.08415, and this Pi Network price prediction reflects current data as of September 18, 2026, making it relevant for anyone tracking Pi Network price today.
Live Market Data
Metric | Value |
Price | $0.08241 |
24h Change | -0.9% |
24h Range | $0.08087 - $0.08415 |
Market Cap | $925.646M |
Fully Diluted Valuation | $1.424B |
24h Trading Volume | $8.683M |
Circulating Supply | 11.233B |
Total Supply | 17.281B |
Max Supply | 100B |
Source: $PI market data taken from CoinGecko, as of Sep 18, 2026. Figures may vary slightly across other tracking websites.
Pi Network News Today
Recent pi coin news has centered on protocol development rather than price alone.
An update from Pi Network's community channel noted that Testnet 1 is now running on Protocol v28, with Testnet 2 potentially following on Protocol v27 soon after. 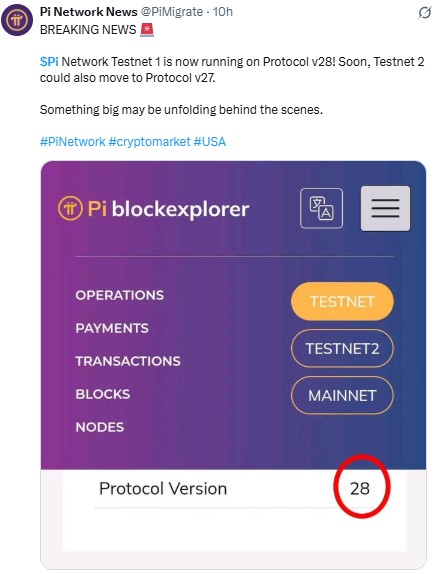
Source: Data Taken From @PiMigrate, X Account, as of Sep 18, 2026
This kind of technical progress often draws renewed attention from traders following Pi Network news today, even as the immediate price action remains focused on the current trendline test.
Technical Analysis: Pi Network Coin Outlook
The daily chart shows $PI holding above a rising trendline that has supported price since early July, with each dip toward the line finding buyers. 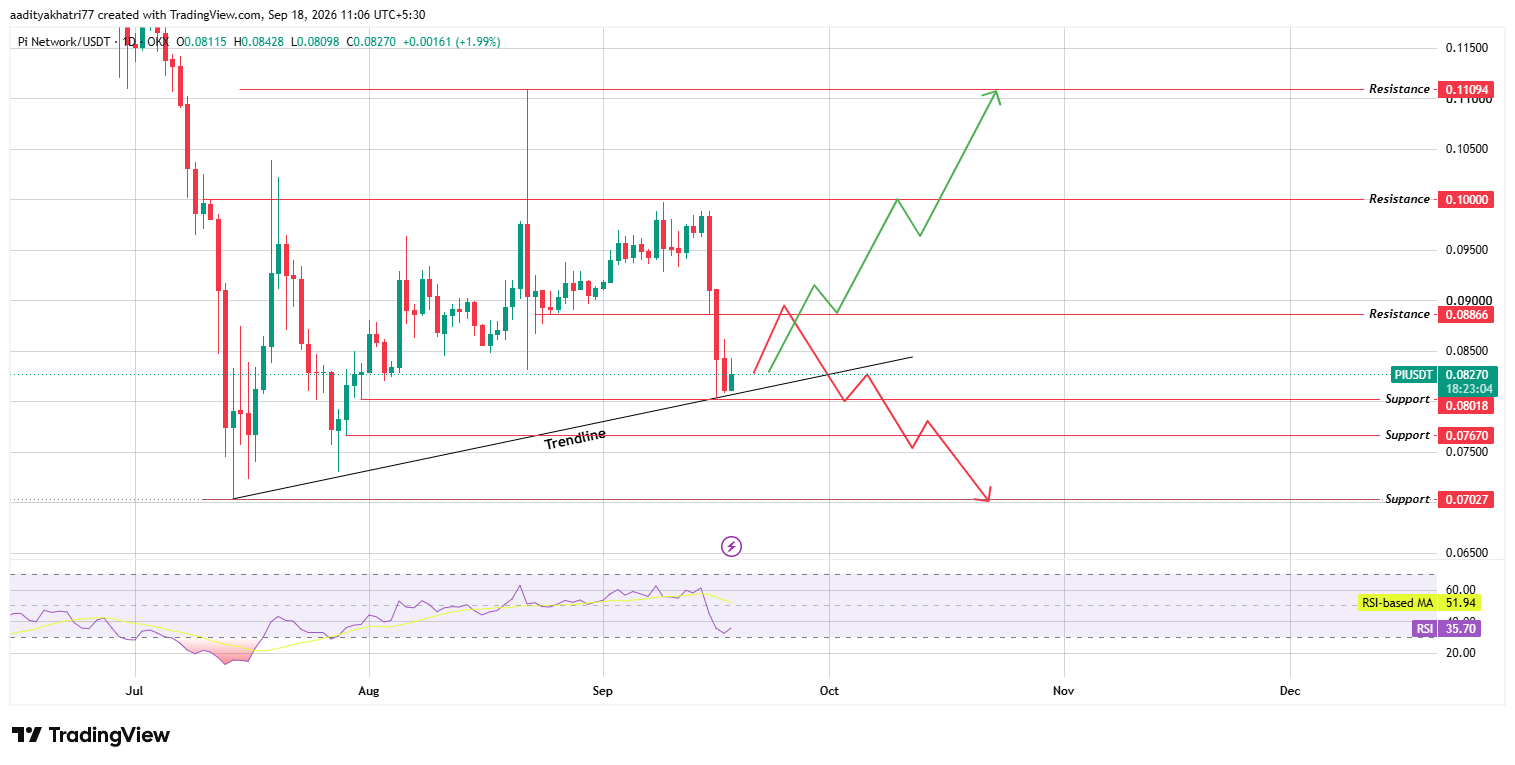
Source: Chart taken from TradingView, as of Sep 18, 2026
Price is now testing resistance directly above this trendline, a zone that has rejected upward attempts twice already this month.
RSI sits at 35.70, below its moving average of 51.94, suggesting momentum has cooled even as the broader structure remains intact.
Can $PI Break Above the Resistance Wall?
If volume picks up and price bounces cleanly off the trendline while clearing the $0.08866 resistance level, the next target sits at $0.10000.
A sustained move beyond that level could open the path toward $0.11094, the zone referenced in ongoing Pi Network price prediction September 2026 discussions among traders.
This scenario requires a confirmed daily close above resistance rather than a brief intraday spike.
What Happens If $PI Gets Rejected Here?
A rejection at current resistance, combined with a break below the rising trendline, would shift the setup bearish. In that case, support at $0.08018 comes into play first.
A deeper breakdown could push the price toward $0.07670, and a more extended decline may test $0.07027 if selling pressure builds and the trendline fails to hold.
Support and Resistance Levels
Support | Resistance |
$0.08018 | $0.08866 |
$0.07670 | $0.10000 |
$0.07027 | $0.11094 |
Bull, Base, and Bear Scenarios
Scenario | Setup | Level |
Bull | Trendline bounce, resistance break with volume | $0.08866 → $0.11094 |
Base | Continued range near trendline and resistance | $0.080 - $0.088 |
Bear | Trendline break, rejection confirmed | $0.08018 → $0.07027 |
Pi Network vs Bitcoin
Pi Network's price movements have shown some correlation with broader market sentiment, though the coin's relatively young trading history and ongoing protocol development mean it can diverge from Bitcoin during periods driven by network-specific news.
A stronger risk appetite across the wider crypto market would likely support $PI's attempt to clear resistance, while a broader pullback could add pressure to the trendline currently holding price up.
Methodology
This pi network price prediction is based on daily chart analysis using trendline mapping, support and resistance identification, and RSI momentum readings.
Price levels are derived directly from the current chart structure rather than speculative extrapolation, and all figures have been cross-checked against live market data as of September 18, 2026.
Expert Opinion
Analysts following $PI's daily structure note that a rising trendline holding through repeated resistance tests often signals accumulating buyer interest, though confirmation typically requires a volume-backed breakout rather than a single green candle.
With price coiling between the trendline and resistance, the next few sessions are likely to determine which direction $PI resolves toward.
Disclaimer: This Pi Network price prediction is based on technical chart analysis and current market data and should not be treated as financial advice. Cryptocurrency markets are highly volatile, and price targets discussed here carry significant uncertainty. Both breakout and breakdown scenarios remain possible, and readers should conduct their own research and consider their risk tolerance before making any investment decisions.


















