US Oil Price Prediction: 100% Tariff Threat Rattles Crude Market


Crude oil markets saw a sharp move on Friday, with WTI sliding hard just as a major new piece of trade policy landed in Washington.
The US oil price prediction picture has turned more complicated after President Trump signed a bill into law that threatens steep tariffs tied to Russian energy trade, adding a fresh layer of uncertainty to an already volatile week for crude.
WTI crude oil, traded as US Oil (USOIL) on most platforms, serves as the primary US benchmark for crude pricing and is closely watched for signals on global energy demand and supply.
Live Market Data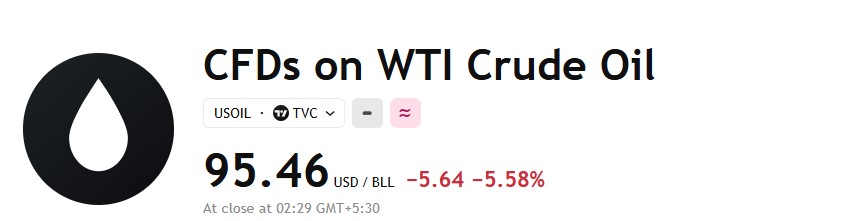
Source: TradingView (USOIL, TVC), as of September 19, 2026.
US Oil News Today
President Trump has signed a Russia sanctions bill into law that allows the White House to impose tariffs of up to 100% on countries ranked among the top five importers of Russian oil or natural gas, according to a widely shared post covering the signing. 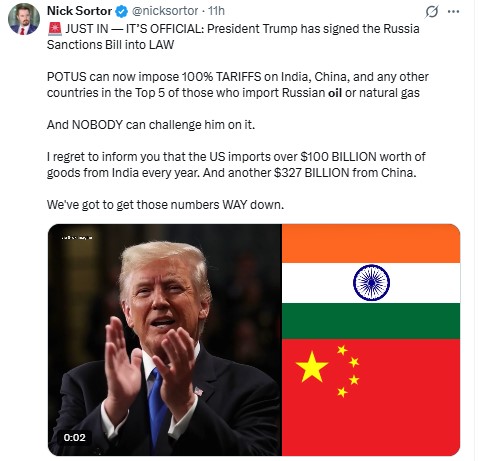
Source: Data Taken From @nicksortor, X Account, as of Sep 19, 2026
The post specifically named India and China as exposed under the new law, noting that the US imports more than $100 billion worth of goods from India and roughly $327 billion from China each year, figures that underline how significant the trade relationships at stake actually are.
The tariff threat lands at a sensitive moment for crude. Prices had already been sliding after Saudi Arabia signaled it could restore a meaningful share of capacity on its damaged East-West pipeline within days, which eased the geopolitical risk premium that had briefly pushed oil to four-month highs.
That supply-side relief was compounded by the Federal Reserve's decision to raise its benchmark rate by 25 basis points on September 16, its first hike since 2023, which strengthened the dollar and added further pressure on dollar-denominated crude.
The combination sent WTI from a session high near $103.48 down to an intraday low of $95.71 before settling close to current levels.
Technical Analysis for US Oil
US Oil's 4-hour chart shows price inside a descending channel that has been in place since September 15, with today's session opening lower right at the channel's lower boundary. 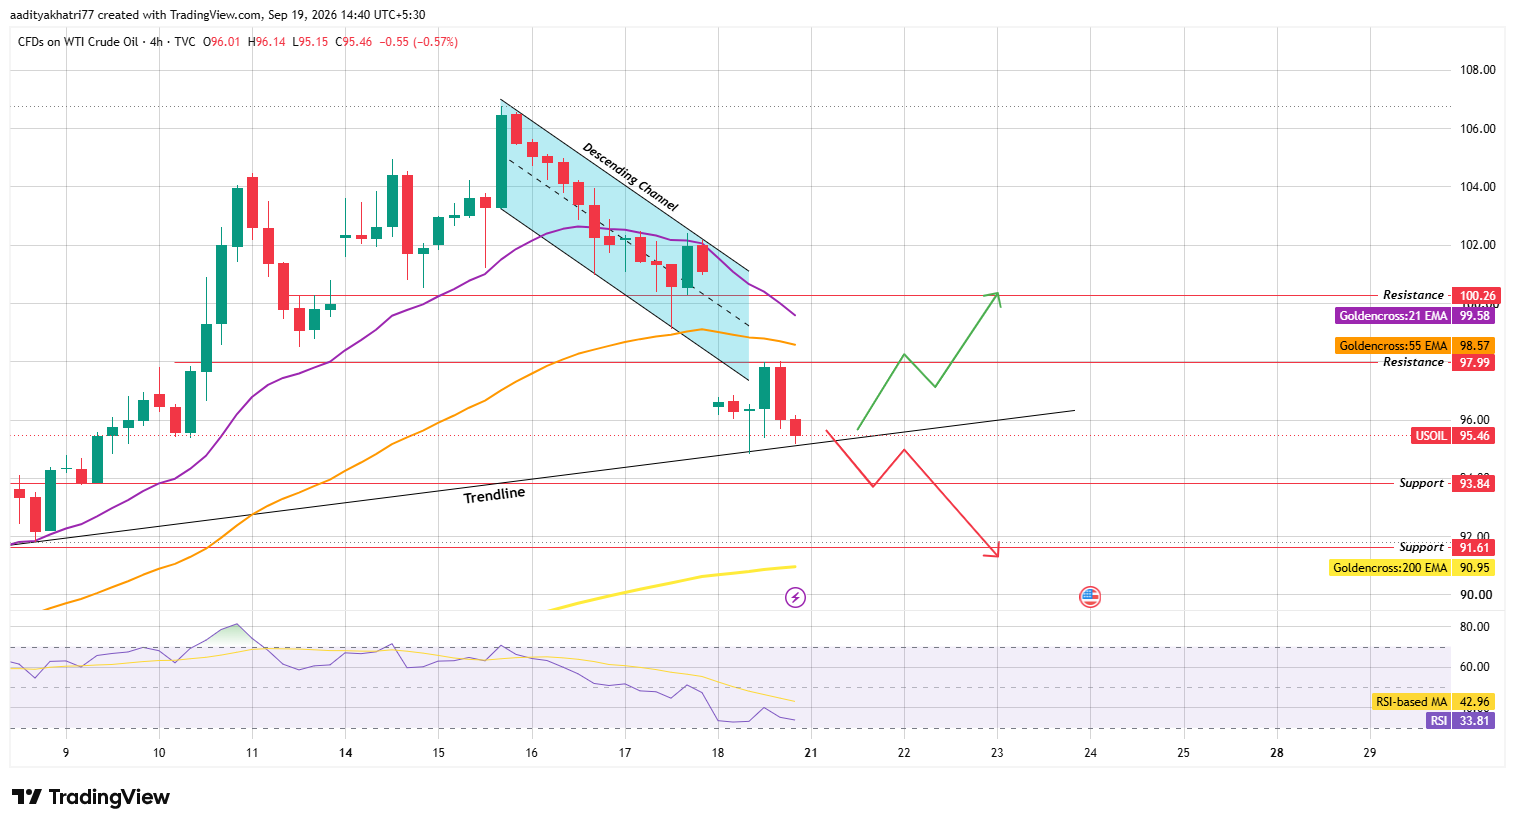
Source: Chart taken from TradingView, as of Sep 19, 2026
Price is currently holding just above a separate rising trendline that has supported the broader move since early September.
The RSI sits at 33.81, below its moving average of 42.96, reflecting oversold-leaning momentum after the sharp decline.
Can US oil bounce and break channel resistance?
If crude holds above the rising trendline and buyers step back in, price could work toward $97.99 first, a level that lines up closely with the 55 EMA at $98.57.
A confirmed break above that zone, backed by the 21 EMA at $99.58, would put $100.26 in view as the next resistance target.
What happens if US oil breaks the rising trendline?
A confirmed break below the trendline would shift the near-term setup lower.
In that case, the price could slide toward $93.84 support first, with $91.61 as the next level to watch.
A deeper breakdown would bring the 200 EMA near $90.95 into focus as a longer-term support zone.
Support and Resistance Levels
| Support | Resistance |
| $93.84 | $97.99 |
| $91.61 | $100.26 |
Bull, Base, and Bear Scenarios
| Scenario | Setup | Level |
| Bull | Bounce off trendline, break above resistance | $97.99–$100.26 |
| Base | Consolidation between trendline and channel boundary | $93.84–$97.99 |
| Bear | Confirmed break below rising trendline | $91.61–$90.95 |
Methodology
This crude oil technical analysis is based on the 4-hour USOIL chart sourced from TVC via TradingView, with all levels measured against confirmed candle closes. Support, resistance, and EMA levels were read directly from the chart, and momentum readings reference the standard 14-period RSI alongside its moving average.
Macro context on the sanctions bill and broader oil market drivers was cross-checked against current market reporting before inclusion, keeping this US Oil Price Prediction grounded in verified information.
Expert Opinion
Energy market analysts generally view the new sanctions law as a source of near-term uncertainty rather than an immediate supply shock, since any tariff action against major importers like India or China would likely take time to implement and could still be negotiated.
From a chart perspective, the rejection from recent highs combined with the RSI nearing oversold territory suggests the market is digesting both the easing Saudi supply risk and the fresh tariff headline at the same time, making the trendline test a key level to watch into next week.
Disclaimer: This article is for informational purposes only and does not constitute financial advice. Commodity markets are highly volatile, and US oil price levels can move sharply in either direction within short timeframes, especially around geopolitical and policy events. There is a meaningful probability that the price fails to reach the targets discussed above, including scenarios where the rising trendline breaks down entirely. Readers should conduct their own research and consult a licensed financial advisor before making investment decisions.


















