XRP Price Prediction: Could XRP Reach $40? FOMC Meeting Week

XRP Price $40 is suddenly the talk of crypto on Twitter. At the same time, Ripple just revealed a $3.1 trillion collateral opportunity for institutions, XRP's ETFs pulled in another $19 million this week, and the Fed's own rate decision lands September 16.
XRP itself is trading near $1.34, down over 2% today. This XRP price prediction sorts the real catalysts from the hype and checks both against what the chart is actually showing right now.
Market data was checked on September 13, 2026, based on the chart timestamped 07:59 (UTC).
XRP Price Today: Market Overview
| Metric | Value |
| Price | $1.3396 |
| 24h Range | $1.34 - $1.37 |
| Market Cap | $84.078B |
| FDV | $133.694B |
| 24h Volume | $935.326M |
| Circulating Supply | 62.879B XRP |
| Total Supply | 99.986B XRP |
| Max Supply | 100B XRP |
| Total Treasury Holding | 473,276,430 XRP |
Source: Data from CoinGecko as of September 13, 2026, at 7:21 IST. Figures may vary slightly across other tracking websites.
XRP News Today ETF Inflows Keep Climbing
BSCN reported that spot XRP ETFs pulled in roughly $19 million in net inflows this week, almost identical to the prior week's $18.96 million, bringing September 2026 inflows to about $32.29 million so far.
Source: Data From BSCN On X
XRP Crypto News Today: Ripple's $3.1 Trillion Collateral Plan
Trader Diana highlighted a Ripple announcement positioning XRP as collateral for institutional credit, meaning institutions could potentially use their XRP to access credit without selling it. 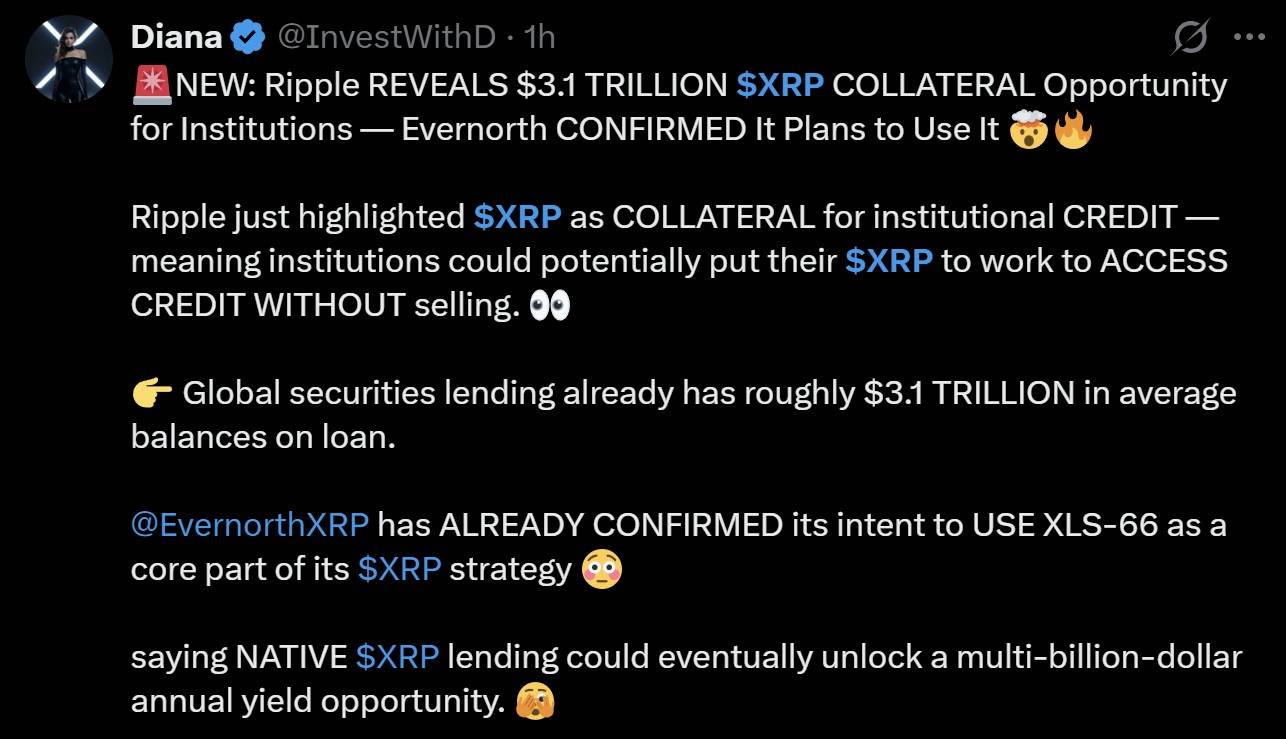
Source: Data From X
The post notes that global securities lending already carries roughly $3.1 trillion in average balances on loan and that Evernorth has confirmed plans to use the XLS-66 standard as a core part of its XRP strategy, with native XRP lending framed as a potential multi-billion-dollar annual yield opportunity.
Note: CoinGabbar could not independently verify the scale of this opportunity.
XRP News: The $40 XRP Claim: Hype or Real?
A trader on X calling $40 XRP "inevitable," using an AI-generated estimate that scaled a single day's modest net inflow into a much larger hypothetical figure to project a multi-trillion-dollar market cap move. 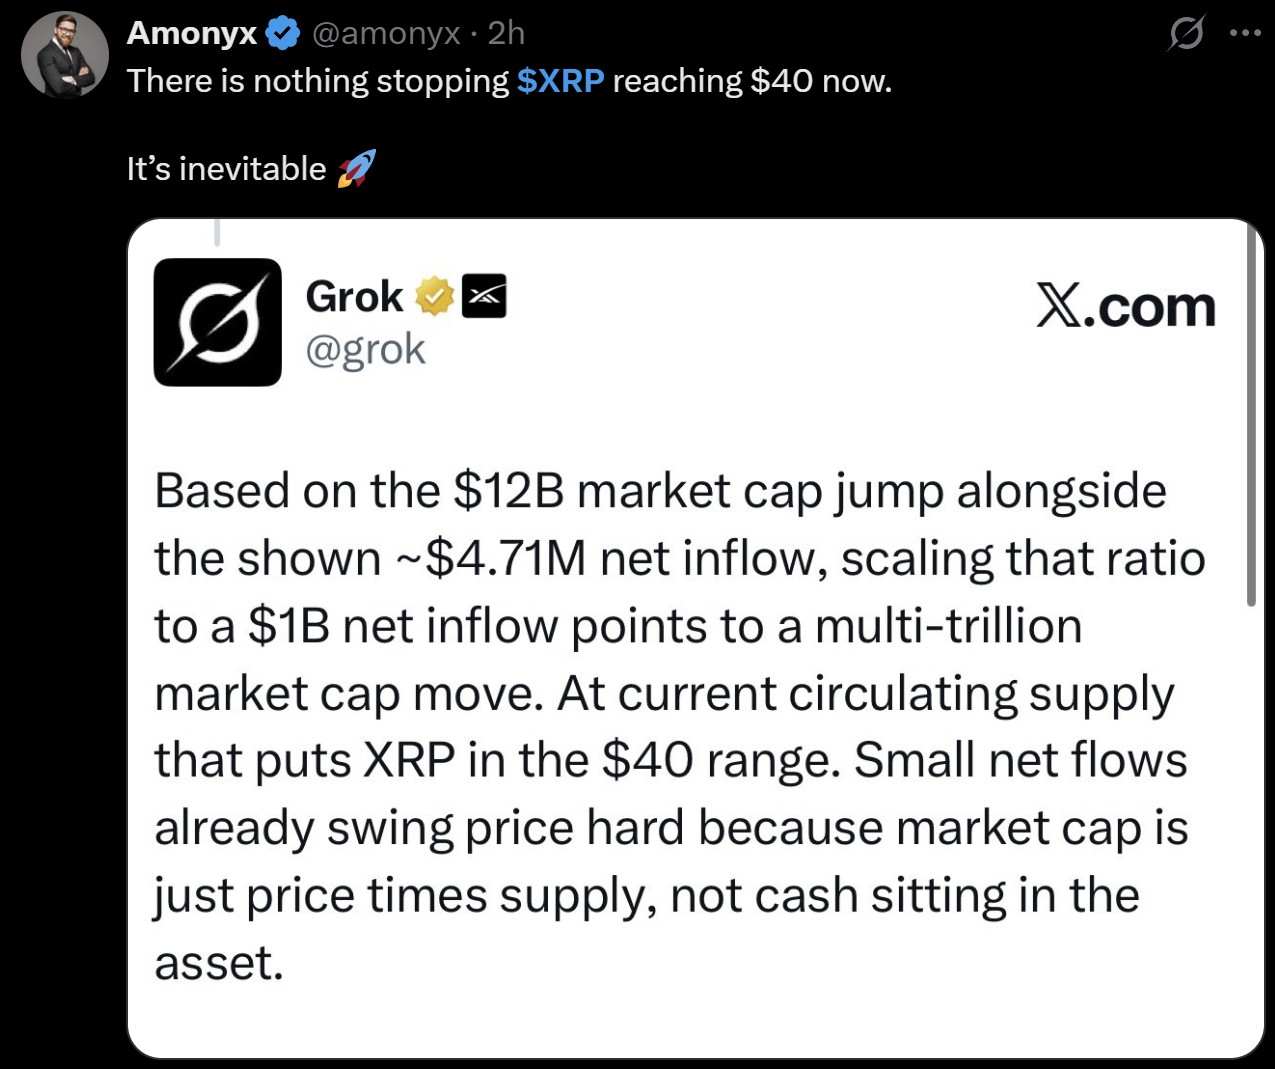
Note: CoinGabbar could not verify this reasoning, and scaling one day's flows linearly doesn't reflect how deep, liquid markets typically behave.
This is speculative social media commentary, not a data-backed forecast.
XRP Price Prediction Chart: Technical Analysis
Pair: XRP/USD · Market: Spot · Timeframe: 1D · Timestamp: September 13, 2026, 09:59 UTC-3
XRP trades at $1.3396, down 2% on the candle, pulling back from a sharp early-September spike into a descending channel and now sitting right at its shorter EMA.
RSI (14, Relative Strength Index) reads 50.56, neutral and cooling from an overbought spike earlier in the month.
The big question is can the price break out of this channel and run the way it did before? If it stays stuck inside the channel, a drop below support would point to more downside.
Right now, the smart move is to just wait. Let the breakout happen first, either way, before betting on the next big move.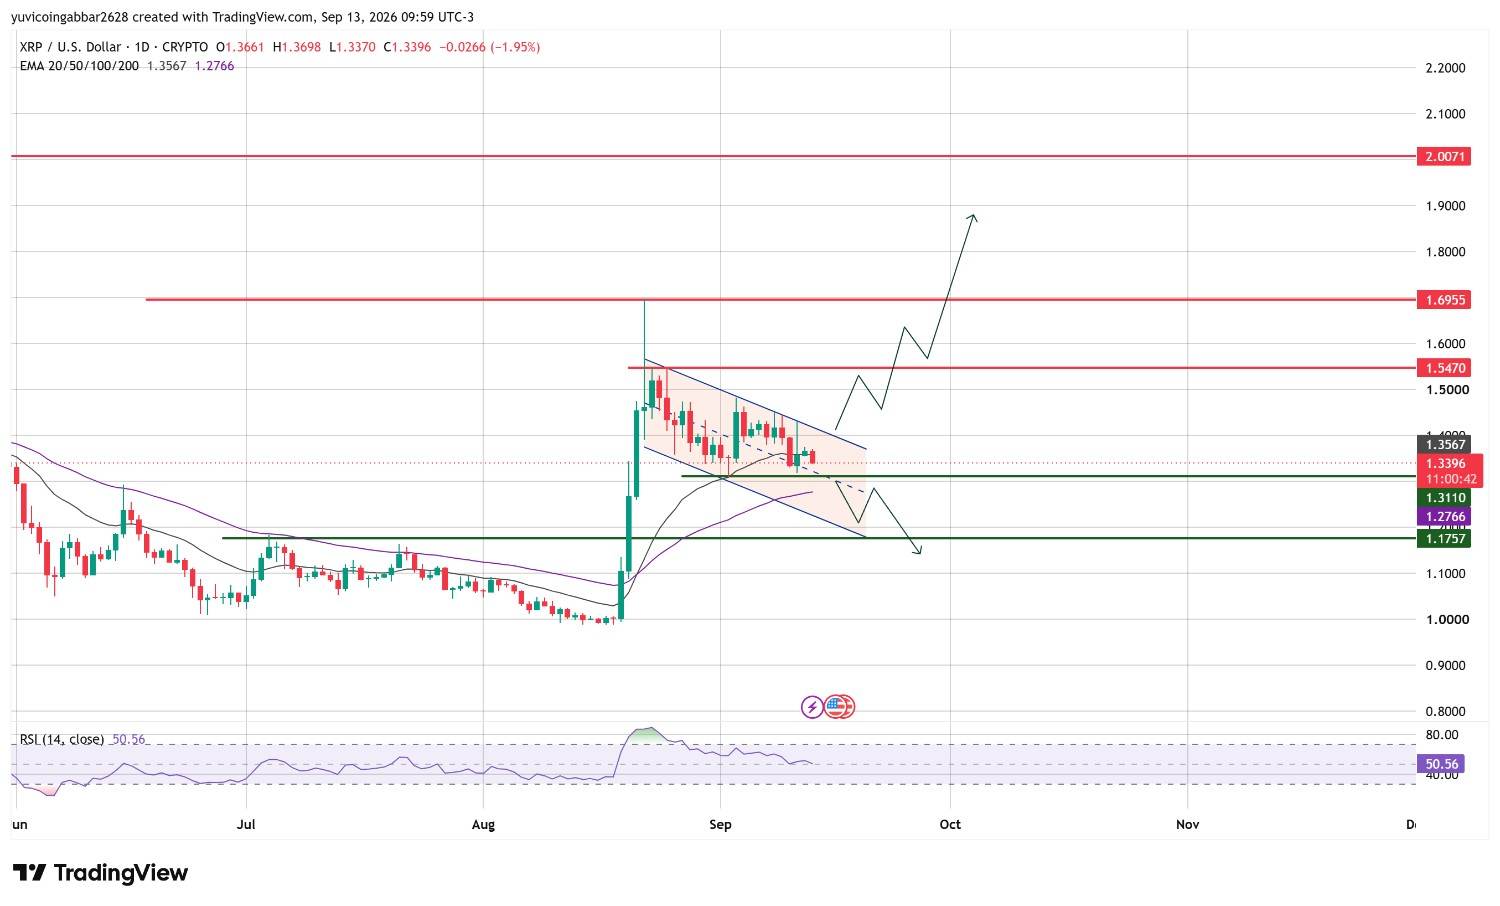
XRP Key Levels to Watch: XRP Outlook
| Level Type | Price |
| Resistance 3 | $2.0071 |
| Resistance 2 | $1.6955 |
| Resistance 1 (nearest) | $1.5470 |
| Immediate Price Reference | $1.3396 |
| First Confirmed Support | $1.3110 |
| Deeper Support | $1.1757 |
XRP Forecast: Bull Case vs Bear Case
Bull case: Reclaiming the EMA near $1.3567 and clearing $1.5470 would open the path toward $1.6955 and eventually $2.0071, especially with a dovish surprise from the Fed on September 16.
That's a meaningful move, though nowhere near the $40 figure some traders are floating.
Bear case: A close below $1.3110 would expose $1.1757, unwinding most of the early-September breakout. A hawkish Fed outcome could accelerate that slide.
XRP Outlook: Triggers and Invalidation
| Scenario | Trigger | Likely Outcome | Invalidation Point |
| EMA reclaim | Close above $1.3567 | Push toward $1.5470 | Rejection back below $1.3396 |
| Support hold | Bounce from $1.3110 | Range continues toward resistance | Close below $1.3110 |
| Support breakdown | Close below $1.3110 | Slide toward $1.1757 | Reclaim of $1.3110 |
XRP Price Prediction: Can XRP Really Reach $40?
$40 would mean XRP growing roughly 30 times from today's price, pushing its market cap toward $2.5 trillion at current circulating supply, well above where any single crypto asset sits today.
The math behind the viral claim stretches one day's modest net inflow into a far larger hypothetical figure and assumes price scales proportionally, which isn't how liquid markets work in practice.
Real catalysts like ETF inflows and the Ripple collateral news are genuine positives, but neither they nor the chart support a $40 target in any near-term timeframe.
The highest resistance actually marked on the chart is $2.0071.
XRP Price Prediction 2026: Expert Analysis
According to CoinGabbar analysts , ETF inflows and the collateral narrative are real, steady positives for XRP, but the $40 talk isn't grounded in the current chart or market size.
The $1.3110 & $1.1757 to $1.5470 zone and the Fed's September 16 decision are what actually matter this week.
Disclaimer
This piece is for informational purposes only and isn't financial advice. The levels and scenarios above are based on technical chart analysis and publicly available data at the time of writing, and crypto markets can move sharply within hours, so past patterns don't guarantee future outcomes. It's worth doing independent research and considering your own risk tolerance before acting on any of the levels discussed here.









.jpg)








