Zcash Price Prediction: Why ZEC Slips After $1,600, Is $2K Possible?


Zcash is cooling off after hitting the $1,600 zone, even as reports claim spot Zcash ETFs just had one of their strongest months yet.
This Zcash price prediction looks at whether $1,451.77 holds as support and the price sets up another run at $1,670.96.
Why Is ZEC Down Today?
Zcash price today was down 6.14% to $1,503.29 over 24 hours in a separate intraday snapshot, underperforming a broader market dip that saw Bitcoin fall 3.59% and the total crypto market cap drop 3.7% over the same period.
The primary driver was profit-taking after ZEC's parabolic run, with a technical pullback from key resistance following the token's rally from around $400 to over $1,600.
The near-term outlook is based on the $1,450 swing low: holding above it points to consolidation ahead of the upcoming NU7 upgrade, while a break below could open a deeper correction toward $1,400.
Zcash News: Reports of Record September ETF Inflows
A widely shared social media post claimed spot Zcash ETFs have already absorbed over $284M in investment this September, with more than a week still left in the month, and that the ETFs, launched less than a month ago, already hold roughly 3.82% of ZEC's circulating supply.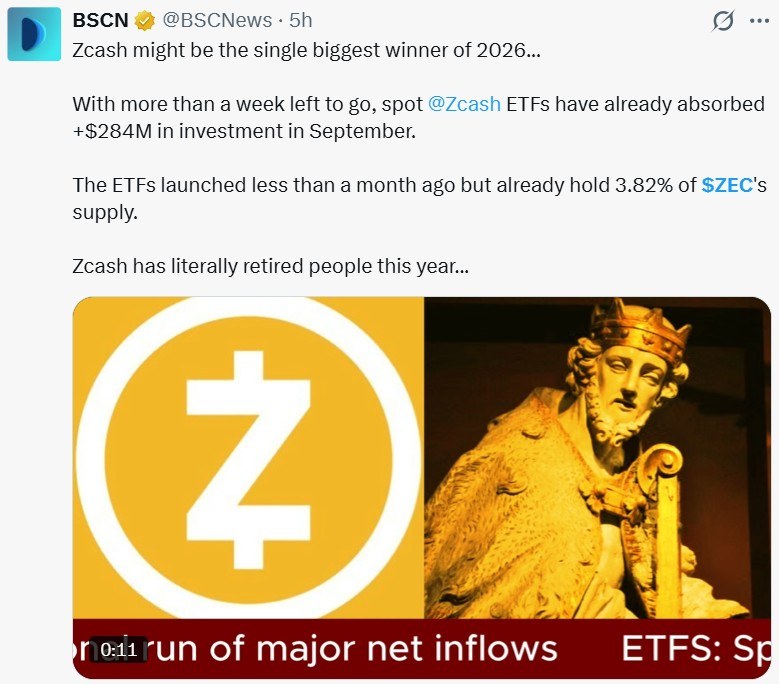
Source: Data From X
CoinGabbar could not independently verify these figures, as no fund-level breakdown or filing date was linked alongside the claim.
Zcash Technical Analysis
Zcash rallied from around $1,240 in mid-September to a swing high near $1,600 on September 23, then pulled back below the EMA 20 as sellers took profit at that level.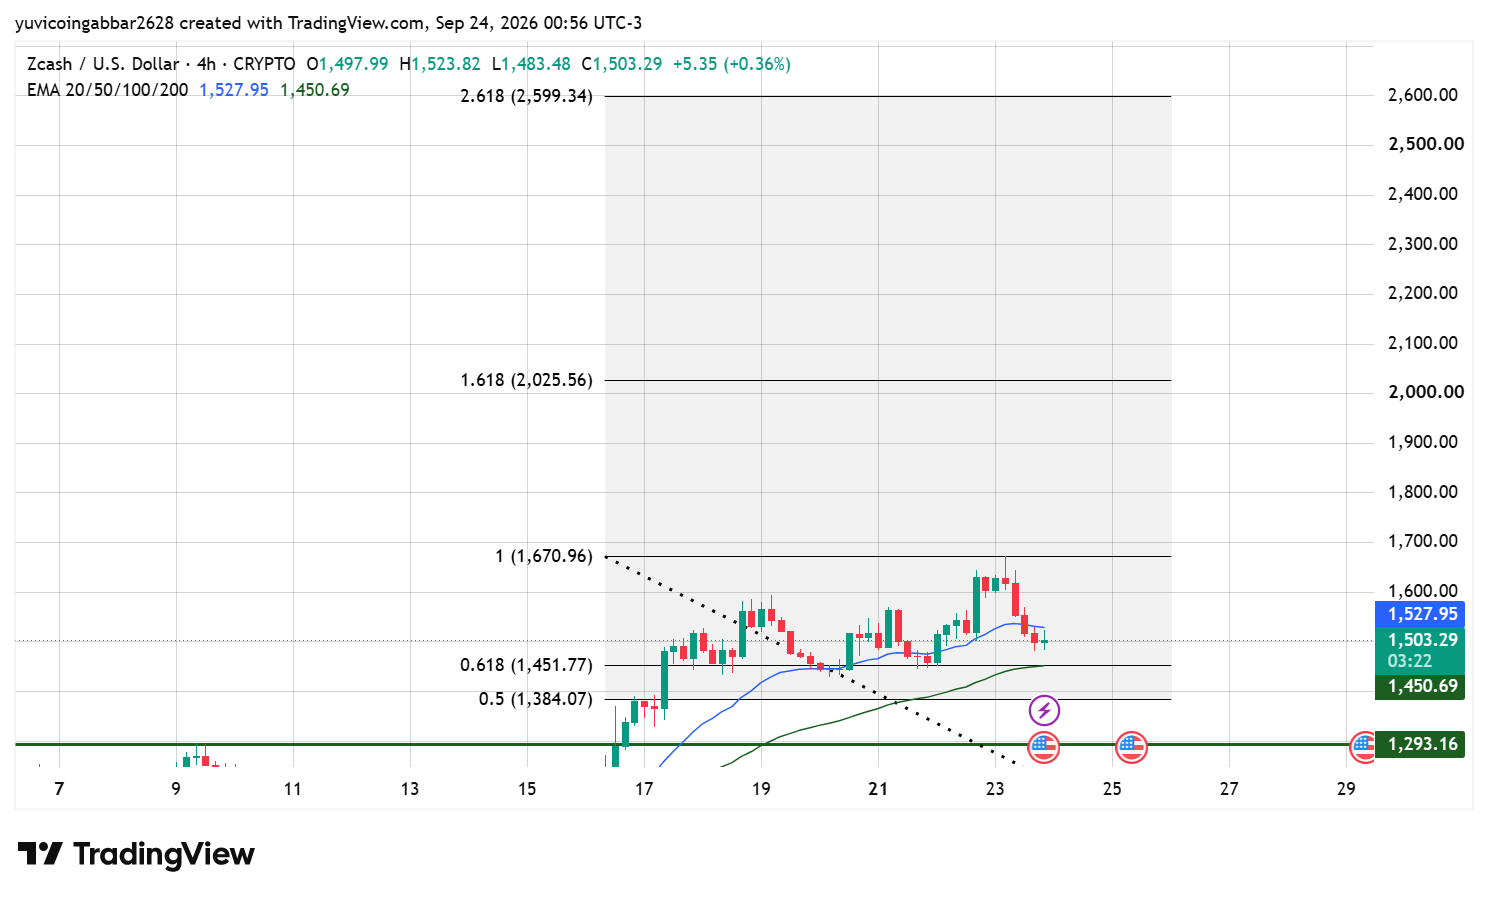
Zcash Price Today is trading at $1,503.29, sitting between the two EMAs, with the 0.618 Fibonacci level at $1,451.77 acting as the nearest support below the current consolidation.
Zcash Outlook: Key Fibonacci Levels
Level Type | Price |
Resistance (2.618 Fib) | $2,599.34 |
Resistance (1.618 Fib) | $2,025.56 |
Resistance (1.0 Fib) | $1,670.96 |
Immediate Price Reference | $1,503.29 |
First Confirmed Support (0.618 Fib) | $1,451.77 |
Deeper Support (0.5 Fib) | $1,384.07 |
Structural Floor | $1,293.16 |
Zcash Forecast
Bull case: Holding above $1,451.77 and reclaiming the EMA 20 at $1,527.95 would suggest this pullback is a normal cooldown after the run to $1,600 rather than a reversal.
A confirmed close back above $1,670.96 would open the path toward the 1.618 Fib extension at $2,025.56, with reported ETF inflows adding a fundamental tailwind.
Bear case: A close below $1,451.77 would put the recent rally in doubt and risk a deeper slide toward the 0.5 Fib level at $1,384.07.
Losing the EMA 50 at $1,450.69 on a closing basis would be an early warning that the broader uptrend from mid-September is weakening.
Zcash Price Prediction: Can Zcash Reach $2,599?
$2,599.34, the 2.618 Fibonacci extension, is the highest level marked on the chart. Getting there would require ZEC to first reclaim $1,670.96 and then clear $2,025.56, a multi-stage move that would likely need sustained ETF inflows well beyond today's pullback.
Zcash Price Prediction 2026: Expert View
According to CoinGabbar analysts, the pullback from $1,600 looks orderly so far, holding above the 0.618 Fib support rather than breaking it outright, which is a healthier setup than a sharp reversal would be.
Reported ETF demand adds a genuine fundamental case, but $1,451.77 is the level that actually confirms whether buyers are still in control before the next leg higher.
Disclaimer
This piece is for informational purposes only and isn't financial advice. The levels and scenarios above are based on technical chart analysis and publicly available data at the time of writing, and crypto markets can move sharply within hours, so past patterns don't guarantee future outcomes. It's worth doing independent research and considering your own risk tolerance before acting on any of the levels discussed here.


















