Will Zcash ZEC Rally to $2,000 After Europe’s First Spot ETP Launch?

ZEC just broke past $1,600 for the first time since 2016, and the move landed right as Europe got its first spot on the Zcash ETP.
This Zcash Price Prediction looks at whether the rally has more room, with $1,594.79 now the level to hold and $1,760.33 the next test above.
Zcash News: 21Shares Launches Europe's First Zcash ETP
CoinGecko reported that ZEC broke past $1,600 for the first time since 2016 after 21Shares launched Europe's first Zcash ETP on Euronext Paris and Amsterdam.
Source: Data From CoinGecko
A regulated exchange-traded product gives institutional and retail investors in Europe direct exposure to ZEC without holding the token themselves, and the listing lines up with the breakout visible on the chart below.
Zcash News Today: Reports of a Seven-Day Spot ETF Inflow Streak
Separate social media reports claim spot Zcash ETFs are now on a seven-day net inflow streak, with only two days of net outflows since launch, and the latest session alone absorbed over $2M in fresh capital, pushing ETF holdings toward roughly 4% of ZEC's circulating supply.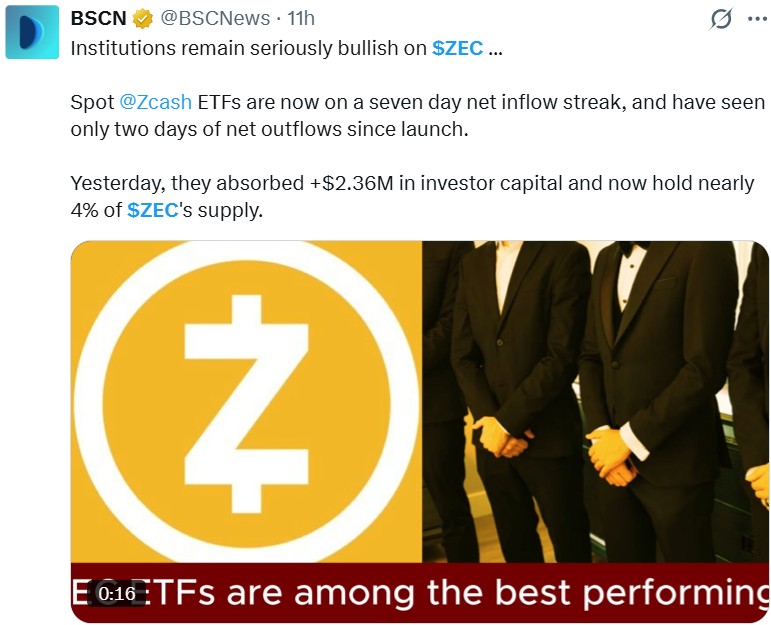
Source: Data From X
CoinGabbar could not independently verify these figures, as no fund-level breakdown, custodian, or filing date was provided alongside the claim.
Zcash Price Forecast: Technical Analysis
Zcash Price Today is trading at $1,605.14, up 10% today. The price is now consolidating just above the 1.0 Fibonacci level near $1,594.79, with both EMAs sitting well below the current price and acting as support rather than resistance.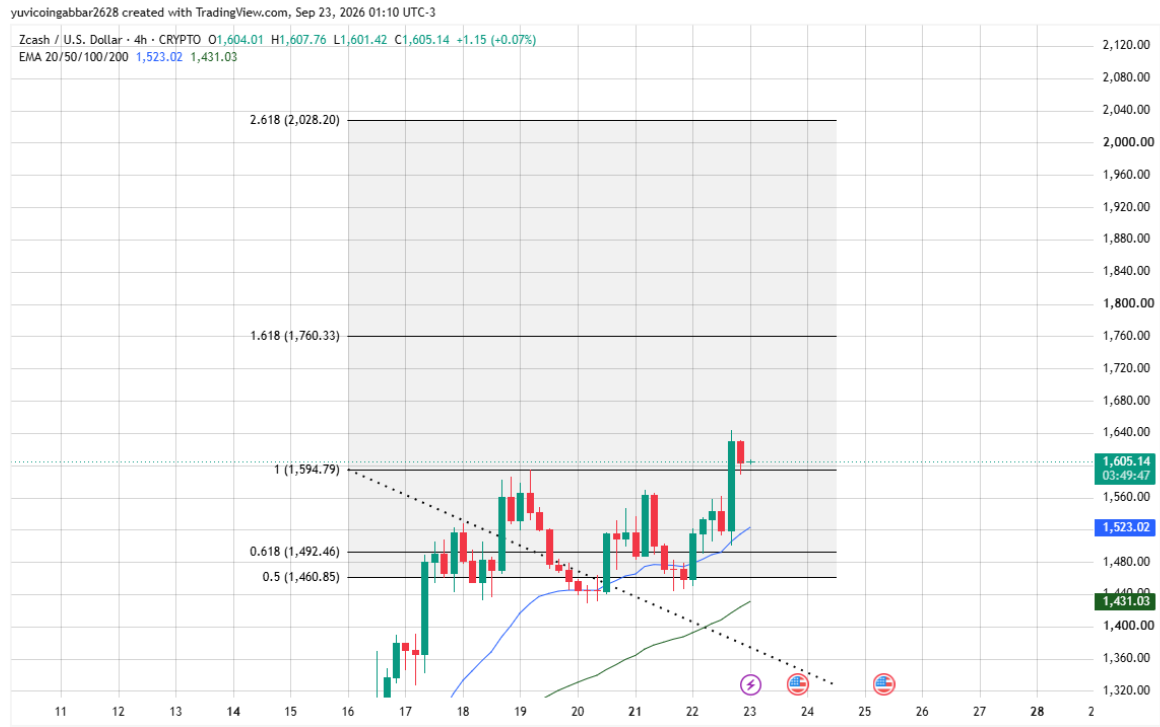
After the sharp rally, the price is consolidating and forming a base, which could allow liquidity to build before the next move.
The structure remains bullish as long as price holds the nearest support and continues to respect the EMAs, keeping the broader uptrend intact.
Zcash Outlook: Fibonacci Support and Resistance Levels
Level Type | Price |
Resistance (2.618 Fib) | $2,028.20 |
Resistance (1.618 Fib) | $1,760.33 |
Immediate Price Reference | $1,605.14 |
First Confirmed Support (1.0 Fib) | $1,594.79 |
Deeper Support (0.618 Fib) | $1,492.46 |
Structural Floor (0.5 Fib) | $1,460.85 |
Zcash Forecast: Upside vs Downside, What’s Next for ZEC?
Bull case: Holding above $1,594.79 and staying clear of the descending trendline it just reclaimed keeps the breakout structure intact.
A confirmed close above the 1.618 Fib level at $1,760.33 would open the path toward the 2.618 extension at $2,028.20, especially with a new European ETP adding a fresh demand channel.
Bear case: A close back below $1,594.79 would put the trendline reclaim in doubt and suggest the move to $1,600 was a short-lived squeeze tied to the ETP news.
Losing the EMA 20 at $1,523.02 would expose the EMA 50 at $1,431.03 and the 0.618 Fib support at $1,492.46 below that.
Zcash Price Prediction: Can Zcash Reach $2,028?
$2,028.20, the 2.618 Fibonacci extension, is the highest level marked on the chart. Getting there would require ZEC to first clear $1,760.33 and hold above it, a move that would likely need sustained ETF and ETP inflows rather than a single news-driven spike.
Zcash Price Prediction 2026: Expert View
According to CoinGabbar analysts, The trendline breakout and the new European ETP listing point to genuine structural demand rather than a one-off pump, but the flat 24h change shows the market is pausing to digest the move.
The $1,594.79 zone is the level to watch: holding it keeps the breakout thesis alive, while losing it would suggest the run to $1,600 needs more time to consolidate before the next leg.
Disclaimer
This piece is for informational purposes only and isn't financial advice. The levels and scenarios above are based on technical chart analysis and publicly available data at the time of writing, and crypto markets can move sharply within hours, so past patterns don't guarantee future outcomes. It's worth doing independent research and considering your own risk tolerance before acting on any of the levels discussed here.


















