Cardano Price Prediction: RealFi Goes Live, What's Next for ADA?

Cardano price prediction heats up as $ADA gets a fresh catalyst and a chart that refuses to go quiet.
RealFi has gone live on the Cardano mainnet, and traders are asking one question: is this the spark ADA has been waiting for? We break down the news, the data, and the levels that decide the answer.
Editorial disclosure: the CoinGabbar desk holds no personal position in ADA.
Cardano Price Today: Live ADA Price, Market Cap, and Volume Data
ADA trades at $0.2538,up0.24%(+0.0006077). Market cap is $9.33B. Futures volume is $676.73M against $121.04M in spot volume, about 5.6 times higher.
Open interest, the total value of unsettled futures contracts, is $555.27M, or 5.95% of market cap. Circulating supply is 36.78B ADA out of a 45.00B max supply, about 81.73%.
Source: CoinGlass, Oct 2, 2026. The chart price of $0.2537 comes from TradingView.
Cardano News Today: RealFi Mainnet Launch and What It Means for ADA
Cardanians (@Cardanians_io), a Cardano community account, said on X about 15 hours ago that RealFi has launched on the Cardano mainnet. The post describes RealFi as a way to put idle stablecoin capital to work by linking it to returns from real-world markets. 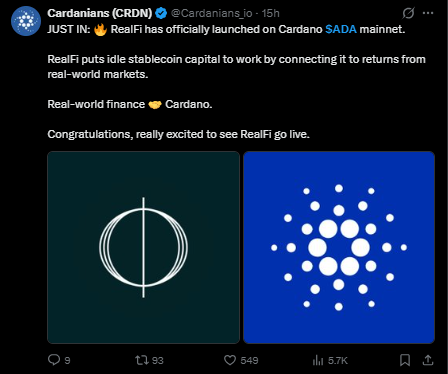
This is a social media claim, and CoinGabbar has not verified it. The post gave no usage or deposit figures.
Why it matters: stablecoin yield products can bring new activity to a network, and more onchain activity can support demand for the ADA used to transact.
That effect depends on real adoption, which is not yet shown. Until usage data appears, treat the launch as a sentiment catalyst, not a confirmed price driver.
Cardano Key Takeaways: ADA Setup, Support Levels, and Price Targets
ADA trades at $0.2537 (1H, MEXC chart, Oct 2, 2026, 11:47 IST) and has held an ascending trendline through repeated retests.
Bullish trigger: 1-hour close above $0.2655 (+4.65%). Target: $0.3130 (+23.37%).
Bearish trigger: 1-hour close below $0.2417 (-4.73%). Next support: $0.2332 (-8.08%).
Futures volume is about 5.6 times spot volume, so derivatives activity shapes short-term moves.
RealFi's mainnet launch is an unverified social media claim with no usage data yet.
Cardano Technical Analysis: ADA Ascending Trendline Support Setup
Structure and trend. ADA is holding above an ascending trendline that price has tested about five times. Each test drew buyers back in, which keeps the short-term structure constructive while the line holds.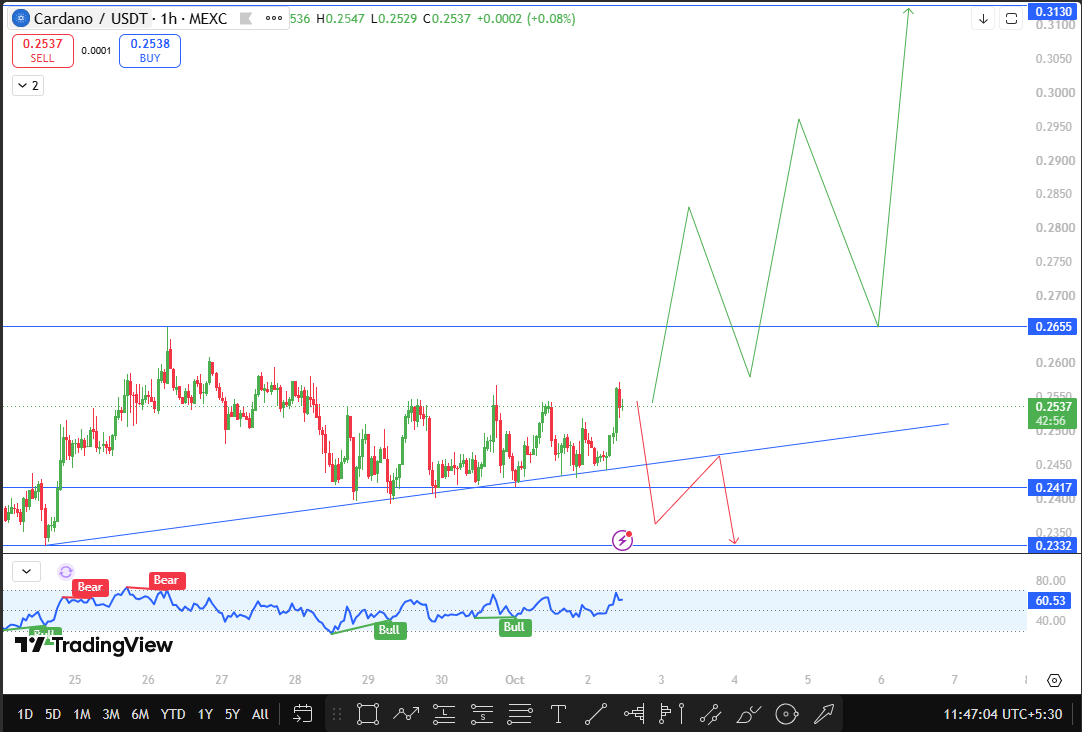
Breakout. $0.2655 is the key resistance, the recent swing high. A 1-hour close above it would clear the range ceiling and open $0.3130, 23.37% above the current price. A move that large needs follow-through, not a single candle.
Breakdown. $0.2417 is the support to protect. A close below it would lose both this level and the ascending trendline, exposing $0.2332, 8.08% lower.
Momentum. The oscillator reads 60.53, so buyers lead without being stretched. Bear labels formed near the Sep 25 and 26 highs, where price stalled. Bull labels formed near the Sep 29 and Oct 1 lows, where sellers lost control.
Volume and open interest. Futures volume of $676.73M against $121.04M in spot volume means derivatives traders influence short-term moves. A breakout backed by spot buying is more reliable than one driven by futures alone.
Confirmation. Both triggers need 1-hour closes, not wicks.
ADA Support and Resistance Levels: Cardano Price Target Zones
Level | Type | Importance | Distance From Current Price |
$0.3130 | Major resistance | Final upside target | +23.37% |
$0.2655 | Resistance, breakout trigger | Swing high. | +4.65% |
$0.2537 | Current price | Trendline hold | 0% |
$0.2417 | Support, invalidation | Loss breaks structure. | -4.73% |
$0.2332 | Support | Next downside target | -8.08% |
Cardano Price Prediction Scenarios: Bullish, Base, and Bearish ADA
Bullish. Confirmation is a 1-hour close above $0.2655. The target is $0.3130. The scenario fails if the price closes back below $0.2655 after breaking out. A successful retest and rising spot volume strengthen it. A thin-volume spike followed by rejection weakens it.
Base. Price stays between $0.2417 and $0.2655, a range of -4.73% to +4.65%, with the trendline continuing to hold. Confirmation is the absence of a 1-hour close beyond either level, and there are no directional targets. A close outside the range ends it. Another clean trendline bounce strengthens it.
Bearish. Confirmation is a 1-hour close below $0.2417. The target is $0.2332. The scenario fails if the price closes back above $0.2417. A failed retest from below strengthens it, and a quick reclaim weakens it.
Cardano Market Context: ADA Derivatives, Leverage, and Liquidity
Futures trade about 5.6 times spot volume, and open interest equals 5.95% of market cap. Leverage matters here, but a close through either trigger can still extend quickly as positions adjust. RealFi, if confirmed, adds a fundamental theme to the chart, but price has to confirm it.
ADA Price Risks: Fake Breakout, Leverage, and News Uncertainty
A 1-hour breakout can reverse within hours. Leverage can cause liquidation wicks around both triggers.
The RealFi news rests on one community post. A trendline tested this many times is widely watched, and a close below $0.2417 would invalidate the setup.
Conclusion: ADA Triggers to Watch Next
This Cardano price prediction depends on two closes. Above $0.2655, the target is $0.3130. Below $0.2417, support is $0.2332. Leverage and a single community-sourced news claim are the main risks, and neither outcome is certain.
Disclaimer
This article is informational only and is not financial advice. Crypto is volatile, and you can lose your entire capital. Do your own research.












.webp)








