Bitcoin Cash Price Prediction: BCH Is Quietly Preparing for Next Wave?


The top level on the Bitcoin Cash chart sits at $560.68, and BCH trades at $314.06 after a 1.43% gain on the latest candle. That is a gap of about 79%. A trader says buyers are building positions again.
This Bitcoin Cash price prediction covers the levels BCH must clear to get there.
Bitcoin Cash News: Trader Sees Strong Accumulation Signals Again
Post on X that BCH is once again showing strong accumulation signals. Accumulation means buyers slowly add to their holdings, usually while the price moves sideways.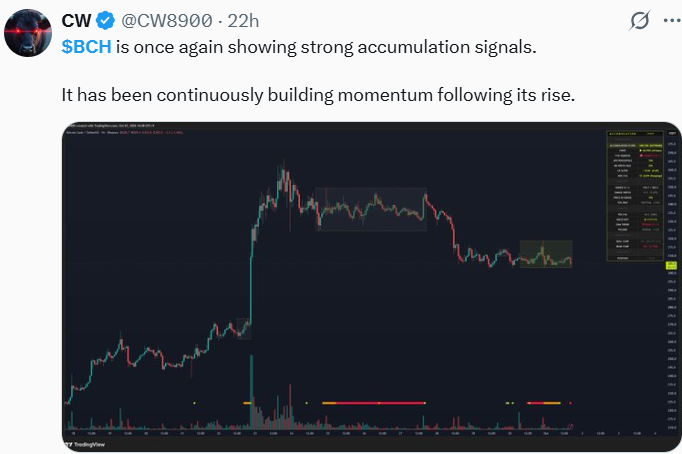
The post adds that BCH has been building momentum since its rise.
The post includes a chart with an accumulation indicator and two boxed ranges marked on it. CoinGabbar could not independently verify how the indicator is calculated or what it measures.
Bitcoin Cash price Today: Technical Analysis
BCH spent late August and most of September in a falling channel. Price broke out of it around September 22 and jumped sharply, topping out just under $360.38.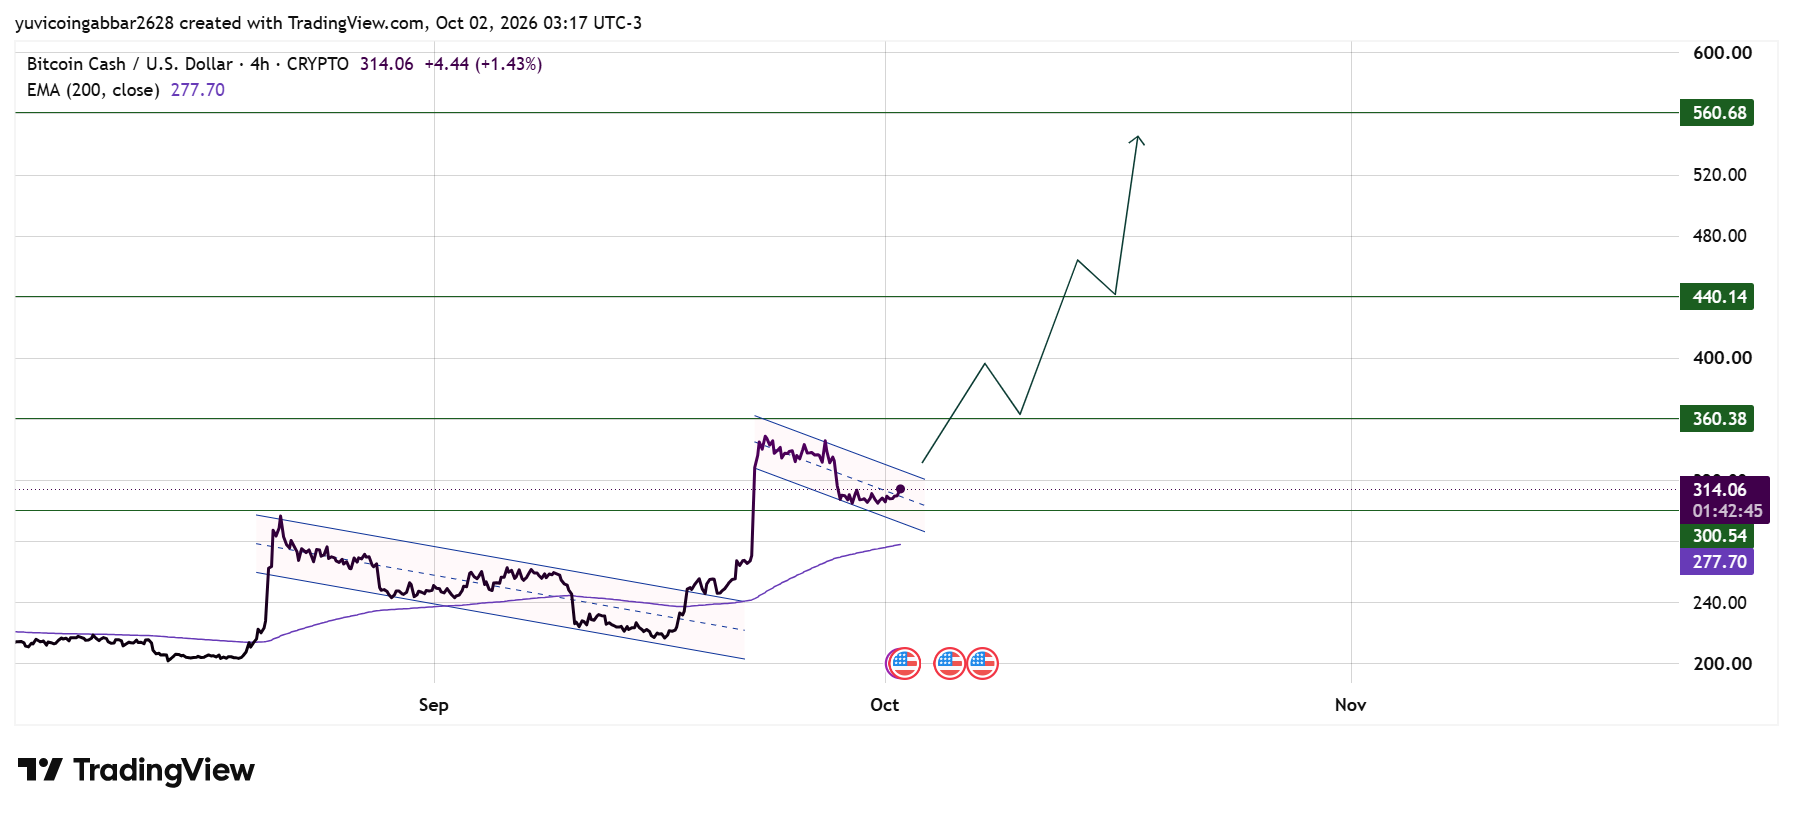
Since then, BCH has slipped into a smaller falling channel and is now trading near its upper half.
Price sits at $314.06, above the 200 EMA at $277.70. An EMA (exponential moving average) is the average price over a set number of candles, with more weight on recent ones.
The 200 EMA is a long-term average, and it is still rising. Staying above it shows the broader trend has not turned.
Bitcoin Cash Price Forecast
Level Type | Price |
Resistance 3 | $560.68 |
Resistance 2 | $440.14 |
Resistance 1 | $360.38 |
$314.06 | |
First Confirmed Support | $300.54 |
Deeper Support (EMA 200) | $277.70 |
Bitcoin Cash Outlook
Bull case: A close above the small channel's upper line would end the pullback and point toward $360.38. Clearing that level opens $440.14, which is the next target on the chart.
Bear case: If $BCH closes below $300.54, the pullback would likely continue. The next support is the 200 EMA near $277.70, and a drop there would put the longer uptrend in question.
Bitcoin Cash price prediction: Can $BCH Reach $560?
The $560.68 level is the highest line on the chart. $BCH would first need to break out of its small channel, then clear $360.38 and $440.14.
Each level would need to hold on close, so $560 is a multi-step move rather than a quick one. The chart's arrow path shows pullbacks along the way.
Bitcoin Cash price prediction 2026: Expert View
According to CoinGabbar analysts, $BCH is holding above $300.54 while it works through a small downward channel. That is a normal pause after a sharp jump, but it needs a breakout to count as a recovery.
The levels to watch are the channel's upper line on the way up and $300.54 on the way down.
Disclaimer
This piece is for informational purposes only and isn't financial advice. The levels and scenarios above are based on technical chart analysis and publicly available data at the time of writing. Crypto markets can move sharply within hours, so past patterns don't guarantee future outcomes. Do your own research and consider your risk tolerance before acting on any level discussed here.












.webp)








