Dogecoin Price Prediction: Can DOGE Reclaim $0.38 From Here?


Dogecoin has spent almost two years compressing into a shrinking range, and the weekly chart now shows the price sitting exactly where that range runs out of room. Traders who track this dogecoin price prediction setup are watching one thing.
closely: whether DOGE finally breaks free or gets pulled back into another leg lower.
Dogecoin began as a joke currency built on the Shiba Inu meme in 2013, but it grew into one of the most traded assets in the crypto market, known for its large community and its role in popularizing meme coins as a category.
Over the past year, price action has cooled considerably compared to its earlier cycles, and the coin now trades far below its all-time high.
The Dogecoin price today is $0.08414, up 3.8% over the past 24 hours. The 24-hour range has held between $0.08054 and $0.08448, and this dogecoin price prediction reflects data current as of September 18, 2026.
Live Market Data
Metric | Value |
Price | $0.08414 |
24h Change | +3.8% |
24h Range | $0.08054 - $0.08448 |
Market Cap | $13.127B |
Fully Diluted Valuation | $13.127B |
24h Trading Volume | $618.74M |
Circulating Supply | 155.961B |
Total Supply | 171.674B |
Max Supply | Unlimited |
Source: $DOGE market data taken from CoinGecko, as of Sep 18, 2026. Figures may vary slightly across other tracking websites.
Exchange Volume
Trading activity remains concentrated on a small group of major exchanges.
Binance leads with $413.68M in 24-hour volume, followed by OKX at $226.43M and Bybit at $108.45M. 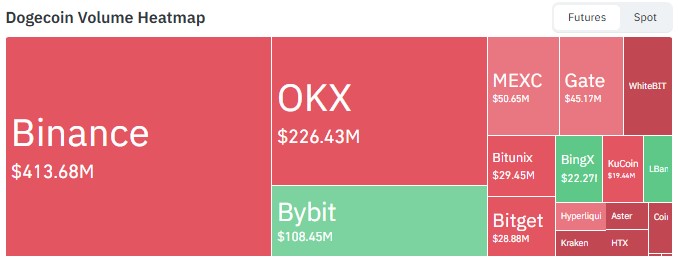
Source: Volume Heatmap Data Taken From CoinGlass, As of Sept 18, 2026.
Mid-tier platforms, including MEXC, Gate, and Bitget, contribute smaller but still meaningful volume, while the remaining liquidity is spread thin across exchanges like KuCoin, WhiteBIT, Bitunix, BingX, and HTX.
Liquidation Snapshot
Timeframe | Total Liquidated | Longs | Shorts |
1h | $309.47K | $5.21K | $304.26K |
4h | $422.11K | $47.92K | $374.19K |
12h | $616.38K | $227.80K | $388.58K |
24h | $1.10M | $359.33K | $740.96K |
Source: Liquidation Data Taken From CoinGlass, As of Sept 18, 2026.
Short positions have absorbed the bulk of the damage over the past day, losing more than double what longs have given up.
This imbalance suggests traders betting against $DOGE have been caught off guard by the recent bounce off the wedge's lower boundary.
If the price continues pushing higher into resistance, additional short covering could add fuel to any upward move, though the opposite is also possible if bulls fail to hold the apex.
Dogecoin News Today
Recent commentary around DOGE has centered on its supply structure.
BSC News published a piece questioning whether Dogecoin's lack of a hard supply cap matters for its long-term value proposition, a debate that resurfaces periodically among analysts covering the coin.
Source: Data Taken From @BSCNews, X Account, as of Sep 18, 2026
Separately, chart-focused commentary has pointed to the same falling wedge pattern highlighted in this dogecoin price prediction, with traders noting that DOGE is currently retesting the upper boundary of that structure and questioning whether a larger move is starting.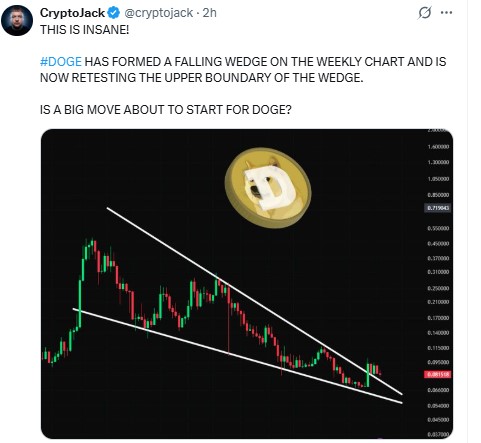
Source: Data Taken From @cryptojack, X Account, as of Sep 18, 2026
Technical Analysis: Dogecoin Price Prediction September 2026
The weekly chart shows $DOGE trapped inside a falling wedge that has been narrowing since its 2024 peak near $0.48. 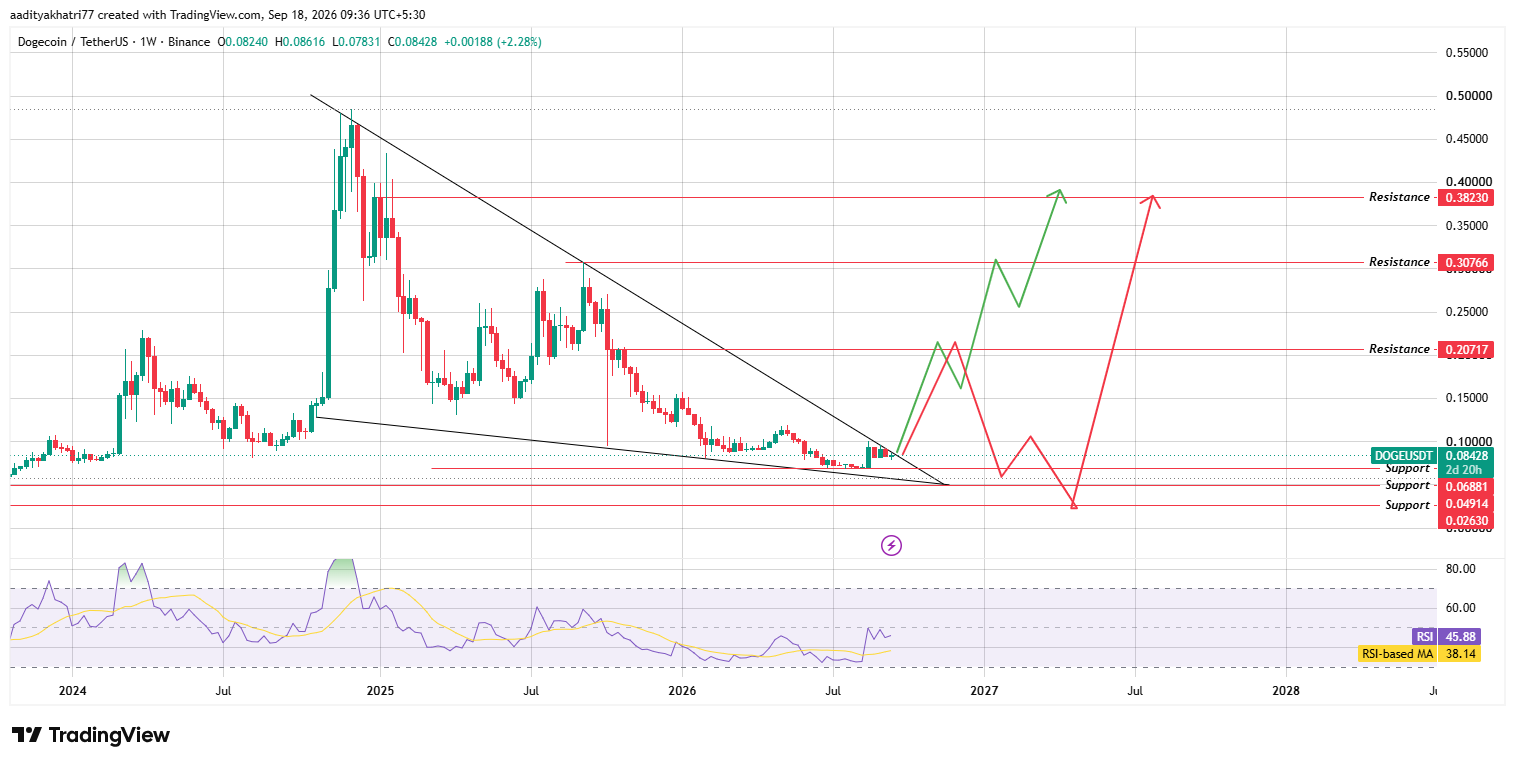
Source: Chart taken from TradingView, as of Sep 18, 2026
Price is now testing the apex of this structure, a point where wedges typically resolve with a sharp directional move rather than continued sideways drift.
RSI sits at 45.88, just below its moving average of 38.14, indicating momentum is neutral but showing early signs of turning upward.
Can $DOGE Push Toward Higher Resistance?
A confirmed weekly close above the upper wedge boundary would open the door toward the first resistance zone at $0.20717.
Should buying pressure hold beyond that level, the next targets sit at $0.30766 and eventually $0.38230, the level referenced in this dogecoin price prediction's headline scenario.
A breakout of this kind would need sustained volume and a clean candle close above the trendline rather than a brief wick through it.
What Happens If $DOGE Gets Rejected?
If the price fails to clear the wedge apex and instead reverses lower, the first support to watch sits at $0.06881.
A breakdown below that level would expose $0.04914, and a deeper decline could stretch toward $0.02630 in a more extended bearish scenario.
This outcome would likely coincide with renewed pressure on long positions, reversing the current liquidation imbalance.
Support and Resistance Levels
Support | Resistance |
$0.06881 | $0.20717 |
$0.04914 | $0.30766 |
$0.02630 | $0.38230 |
Bull, Base, and Bear Scenarios
Scenario | Setup | Level |
Bull | Weekly close above wedge trendline | $0.20717 → $0.38230 |
Base | Continued consolidation near apex | $0.08 - $0.09 |
Bear | Rejection at apex, breakdown confirmed | $0.06881 → $0.04914 |
DOGE vs Bitcoin
Dogecoin's price action has broadly tracked Bitcoin's wider market cycles, though with amplified swings in both directions.
During periods when Bitcoin has traded sideways, $DOGE has often shown similar consolidation, as seen in the extended wedge pattern forming on its weekly chart.
A meaningful move in Bitcoin, particularly a shift in risk appetite across the broader market, would likely influence whether $DOGE resolves its wedge to the upside or downside.
Methodology
This dogecoin price prediction is based on weekly chart analysis using trendline mapping, support and resistance identification, and RSI momentum readings.
Price levels are derived directly from the current wedge structure rather than speculative extrapolation, and all figures have been cross-checked against live market data as of September 18, 2026.
Expert Opinion
Market analysts tracking DOGE's weekly structure note that falling wedge patterns nearing their apex tend to produce decisive moves rather than prolonged consolidation.
Given the current proximity to both trendlines, a resolution one way or the other appears likely within the coming weeks, though the direction remains dependent on broader market conditions and volume confirmation at the breakout point.
Disclaimer: This dogecoin price prediction is based on technical chart analysis and current market data and should not be treated as financial advice. Cryptocurrency markets are highly volatile, and price targets discussed here carry significant uncertainty. Both breakout and breakdown scenarios remain possible, and readers should conduct their own research and consider their risk tolerance before making any investment decisions.


















