Dogecoin Price Prediction: DOGE Surges as ETFs Bleed $763K


Dogecoin price prediction right now has to start with the chart, because DOGE just did something it hadn't done in over a week.
Dogecoin launched back in December 2013, half as a joke and half as a genuine experiment in what a community-driven coin could look like.
Over a decade later it's still one of the most actively traded meme coins out there, sitting at #12 by market cap.
$DOGE is currently trading at $0.08708, up 4.4% on the day. The market cap works out to $13.565B, backed by a circulating supply of about 155.773 billion coins.
Dogecoin Live Market Data
Metric | Value |
Price | $0.08708 |
24h Change | +4.4% |
24h Range | $0.08255 – $0.08987 |
Market Cap | $13.565B |
Fully Diluted Valuation | $13.565B |
24h Trading Volume | $1.008B |
Circulating Supply | 155.773B |
Total Supply | 171.485B |
Max Supply | ∞ (Uncapped) |
Total Treasury Holding | 802,235,229 |
Dogecoin Exchange Volume
Binance is doing most of the heavy lifting with $705.44M in 24-hour futures volume. OKX follows at $376.14M, then Bybit at $185.40M.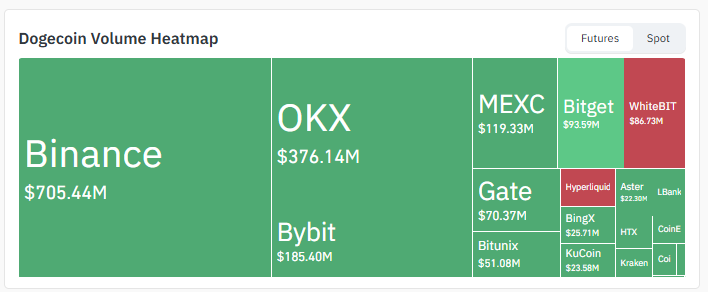
Source: Volume Heatmap Data Taken From CoinGlass, As of Sep 4, 2026
Below those three, MEXC came in at $119.33M, Bitget at $93.59M, and WhiteBIT at $86.73M.
Gate, Bitunix, BingX, Aster, and KuCoin all posted smaller numbers between $22M and $70M, with the rest scattered across Hyperliquid, HTX, LBank, and CoinEx. Nothing unusual here.
$DOGE volume has leaned on Binance for years, and this breakout hasn't changed that.
Dogecoin Liquidation Data
Timeframe | Total Liquidated | Longs | Shorts |
1h | $50.78K | $50.76K | $16.73 |
4h | $108.95K | $93.11K | $15.84K |
12h | $812.98K | $709.48K | $103.50K |
24h | $6.20M | $1.54M | $4.66M |
Over 24 hours, shorts got hammered, with $4.66M wiped out versus $1.54M on longs, which tracks with how sharp the breakout candle was.
But narrow it down to the last hour or four, and it's flipped: longs are the ones eating losses now as price retests support.
Typical pattern: after a fast move, shorts squeezed on the way up, late longs pile in near the top, then get shaken loose on the pullback.
Dogecoin News
As per BSCN (@BSCNews): Spot $DOGE ETFs saw net outflows of as much as -$763,000 on September 2.
Source: Data Taken From @BSCNews, X Account, As of Sep 04, 2026
Why it matters: That outflow basically erased whatever inflow momentum these ETFs had built up.
Worth remembering these products still hold under 0.1% of DOGE's total supply, 0.09%, to be exact.
So whatever's pushing DOGE higher right now isn't coming from regulated ETF vehicles. It's coming from the exchanges.
Dogecoin Price Prediction Outlook: Technical Analysis
The 4-hour DOGE/USDT chart on Binance shows the price finally breaking out of a descending channel it had been stuck in for over a week.
The breakout candle came with real volume behind it and pushed DOGE above all three key EMAs in one move.
Right now the price has pulled back and is sitting in the same zone it broke out from, basically a retest. Where it goes from here isn't decided yet.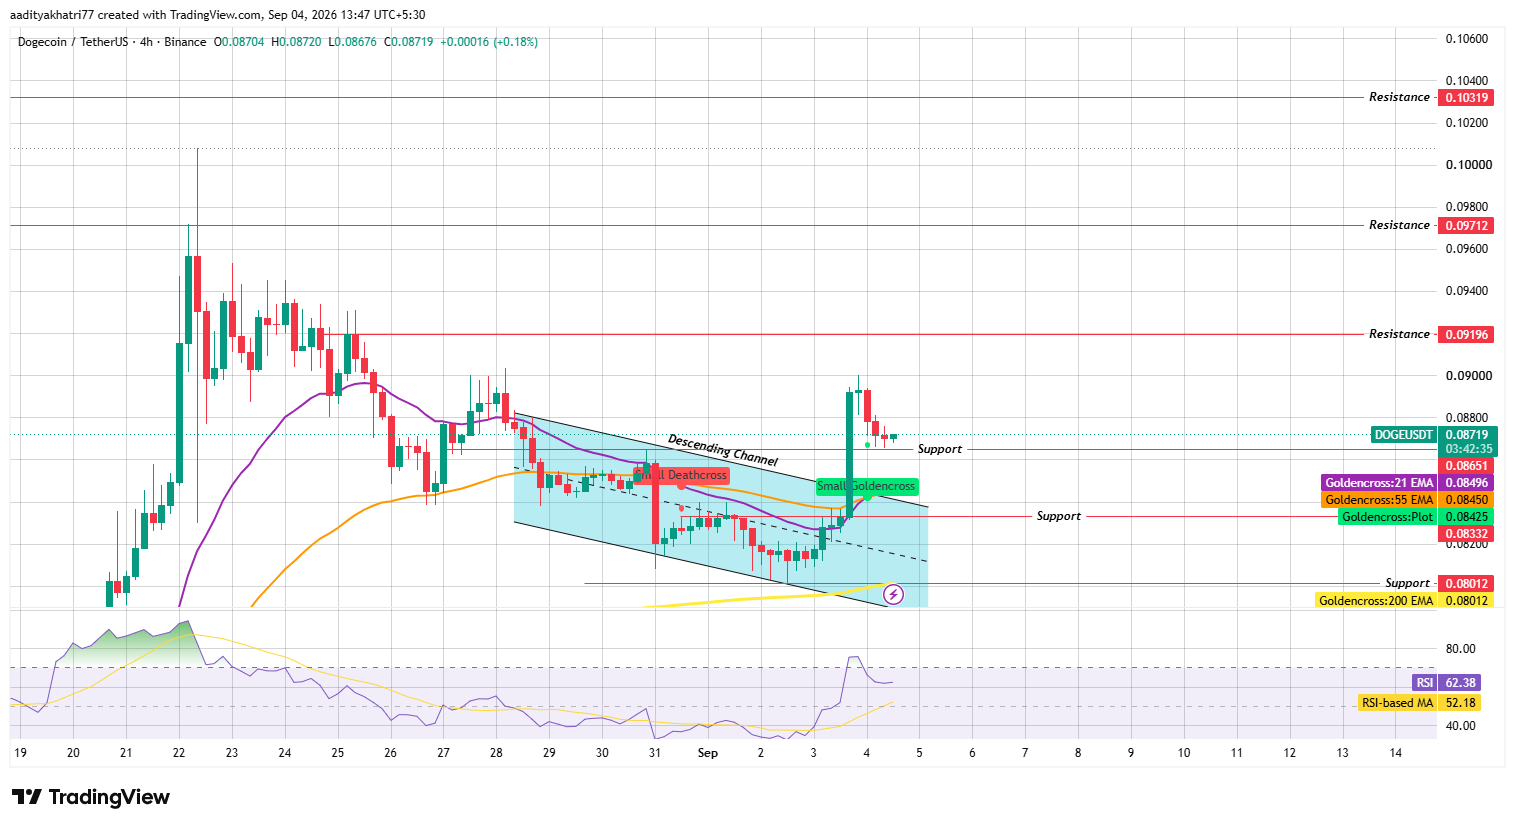
Source: Chart Taken From TradingView, As of Sep 4, 2026
Can $DOGE Push Toward Higher Resistance?
For the bulls to stay in control, $DOGE needs to hold this retest around $0.0842–$0.0850 and stay above the 21 EMA at $0.08496.
Do that, and $0.09196 comes into view first, then $0.09712, with $0.10319 as the bigger target further out.
What Happens If DOGE Breaks the Support Zone Instead?
If this retest fails, meaning $DOGE closes back below the breakout zone on decent volume, things get less comfortable fast.
The next stop would be $0.08012, which lines up with the 200 EMA. Lose that too and you're looking at a slide back into the old channel.
RSI is sitting at 62.38 with its moving average at 52.18, in bullish territory but nowhere near overbought, so there's room to run if buyers show up.
That said, the gap between RSI and its MA has narrowed since the initial breakout spike, so momentum has cooled a bit.
Dogecoin Support and Resistance Levels (4H Chart)
Level Type | Price |
Resistance 3 | $0.10319 |
Resistance 2 | $0.09712 |
Resistance 1 | $0.09196 |
Support 1 | $0.08425 |
Support 2 | $0.08012 |
EMA | Value | Price Position |
21 EMA | $0.08496 | Price trading above |
55 EMA | $0.08450 | Price trading above |
200 EMA | $0.08012 | Price trading above |
Scenario | Setup | Level |
Bull Case | Support retest holds, and the price stays above the 21 EMA. | $0.09196, then $0.09712, and $0.10319 |
Base Case | Price chops around the breakout/retest zone | Range-bound between $0.0842 and $0.0900 |
Bear Case | Retest fails, price closes back below breakout zone | $0.08012, with risk of deeper slide toward old channel lows |
Descending Channel: Two parallel trendlines sloping down, with price bouncing between them until it breaks out one way or the other.
EMA (Exponential Moving Average): Weighs recent prices more heavily than a regular average, so it reacts quicker to what's happening now.
Golden Cross: A short-term average crossing above the long-term one is usually read as early upside momentum.
Death Cross: The reverse of the short-term average crossing below the long-term one, generally bearish.
RSI (Relative Strength Index): A 0–100 momentum gauge showing how fast and how far price has moved, used to spot overbought or oversold conditions.
Liquidation: When an exchange force-closes your leveraged position because there's not enough margin left, usually because the price moved against you.
Support Zone: An area where buyers have shown up before and stopped a decline.
Resistance Zone: A spot where sellers have historically capped a rally.
Dogecoin vs Bitcoin
$DOGE has been moving pretty much in lockstep with Bitcoin the last several sessions; meme coins tend to follow the market leader rather than chart their own course.
Bitcoin price today near $81,000 right now, and since it sets the tone for the whole market, its next move matters for DOGE too.
Where the two differ is how their support holds up. Bitcoin's order book is stacked with bigger players and long-term holders who defend key levels with real size, so its support zones tend to hold in a more predictable way.
$DOGE's book is much more retail and much more leverage-driven, which is exactly why you get liquidation swings of $812.98K in just 12 hours on a coin worth $13.5B. You wouldn't see that ratio on Bitcoin.
If Bitcoin holds steady or climbs, that probably helps $DOGE clear its resistance levels too. If Bitcoin rolls over instead, the $DOGE support retest could break down just as fast and likely sharper than whatever Bitcoin itself does.
Expert Opinion
The conversation around Dogecoin right now comes down to a disconnect: exchange traders are clearly excited about this breakout, but money flowing into regulated products like spot
ETFs tells a quieter story. Analysts covering meme coins note that clearing the descending channel and holding above all three EMAs are genuinely bullish signs.
At the same time, those ETF outflows are a reminder this rally hasn't attracted much institutional interest yet.
Whether DOGE keeps climbing from here probably comes down to one thing: can it hold this support retest and push through $0.09196 on the 4-hour chart. That's the level worth watching over the next day or two.
Disclaimer: This article is for informational purposes only and does not constitute financial advice. Cryptocurrency markets, including Dogecoin (DOGE), are highly volatile, and prices can move sharply in either direction within short periods. The bull, base, and bear scenarios outlined above are technical projections based on available chart data and are not guarantees of future performance. There is a realistic possibility that DOGE could fail to reach any of the stated levels or could decline well below the support levels discussed, including in the event of broader market downturns or continued outflows from related investment products. Readers should conduct their own research and consult a qualified financial advisor before making investment decisions.
Also read:
















