Dogecoin Price Prediction: Does Bitcoin's Scarcity Matter For DOGE?


Dogecoin has spent weeks squeezing into a tighter and tighter range, and that compression is finally reaching its limit.
Traders who track Dogecoin price prediction closely know this kind of setup rarely stays quiet for long, and the next move could set the tone for weeks ahead.
Dogecoin (DOGE) began as a joke inspired by the Shiba Inu meme back in 2013, but it has since grown into one of the most actively traded cryptocurrencies by volume.
Its open, uncapped supply structure has always set it apart from coins built around fixed scarcity.
The Dogecoin price today is $0.08019, down 3.6% over the past 24 hours.
Price has moved within a 24-hour range of $0.07867 to $0.08335, with a market capitalization of $12.511 billion.
Live Market Data
Metric | Value |
Price | $0.08019 |
24h Change | -3.6% |
Market Cap | $12.511B |
Fully Diluted Valuation | $13.772B |
24h Trading Volume | $847.382M |
Circulating Supply | 155.934B |
Total Supply | 171.647B |
Max Supply | Unlimited |
Exchange Volume
Trading activity remains concentrated on a handful of major exchanges. Binance leads with $600.77 million in 24-hour volume, followed by OKX at $341.86 million and WhiteBIT at $153.71 million. 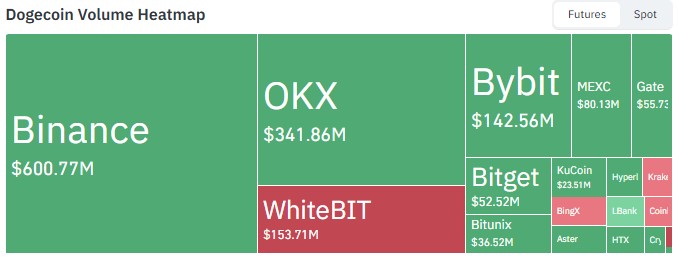
Source: Volume Heatmap Data Taken From CoinGlass, As of Sept 16, 2026.
Bybit added $142.56 million, while MEXC, Gate, Bitget, and several smaller platforms rounded out the remaining liquidity.
Dogecoin Liquidation Data
Timeframe | Total Liquidated | Longs | Shorts |
1h | $12.65K | $11.73K | $924.33 |
4h | $49.47K | $47.07K | $2.40K |
12h | $5.23M | $5.00M | $232.64K |
24h | $8.26M | $7.87M | $390.20K |
The imbalance here is hard to miss. Long positions accounted for roughly 95% of the 24-hour liquidation total, showing that leveraged buyers absorbed most of the pain during the recent pullback.
This kind of long-heavy wipeout often clears out weak hands before a more decisive move develops.
Dogecoin News Today
BSCN recently published a breakdown comparing Dogecoin's supply model to Bitcoin's, and it ties directly into the current market debate.
Bitcoin caps its total supply at 21 million coins, with mining rewards halving every few years, tightening issuance over time. 
Source: Data Taken From @BSCNews, X Account, as of Sep 16, 2026
Dogecoin works differently, according to the outlet. There is no maximum supply, and roughly 10,000 DOGE enters circulation with each new block, adding around 5.2 billion new coins annually.
BSCN noted that while Dogecoin's total supply keeps expanding, the inflation rate itself falls over time in percentage terms as the base grows larger.
The outlet framed this as a fundamentally different monetary design, one built around predictable issuance rather than a hard cap.
Dogecoin Technical Analysis
The daily DOGE/USDT chart on Binance shows the price consolidating inside a symmetrical triangle that has been forming since late August. 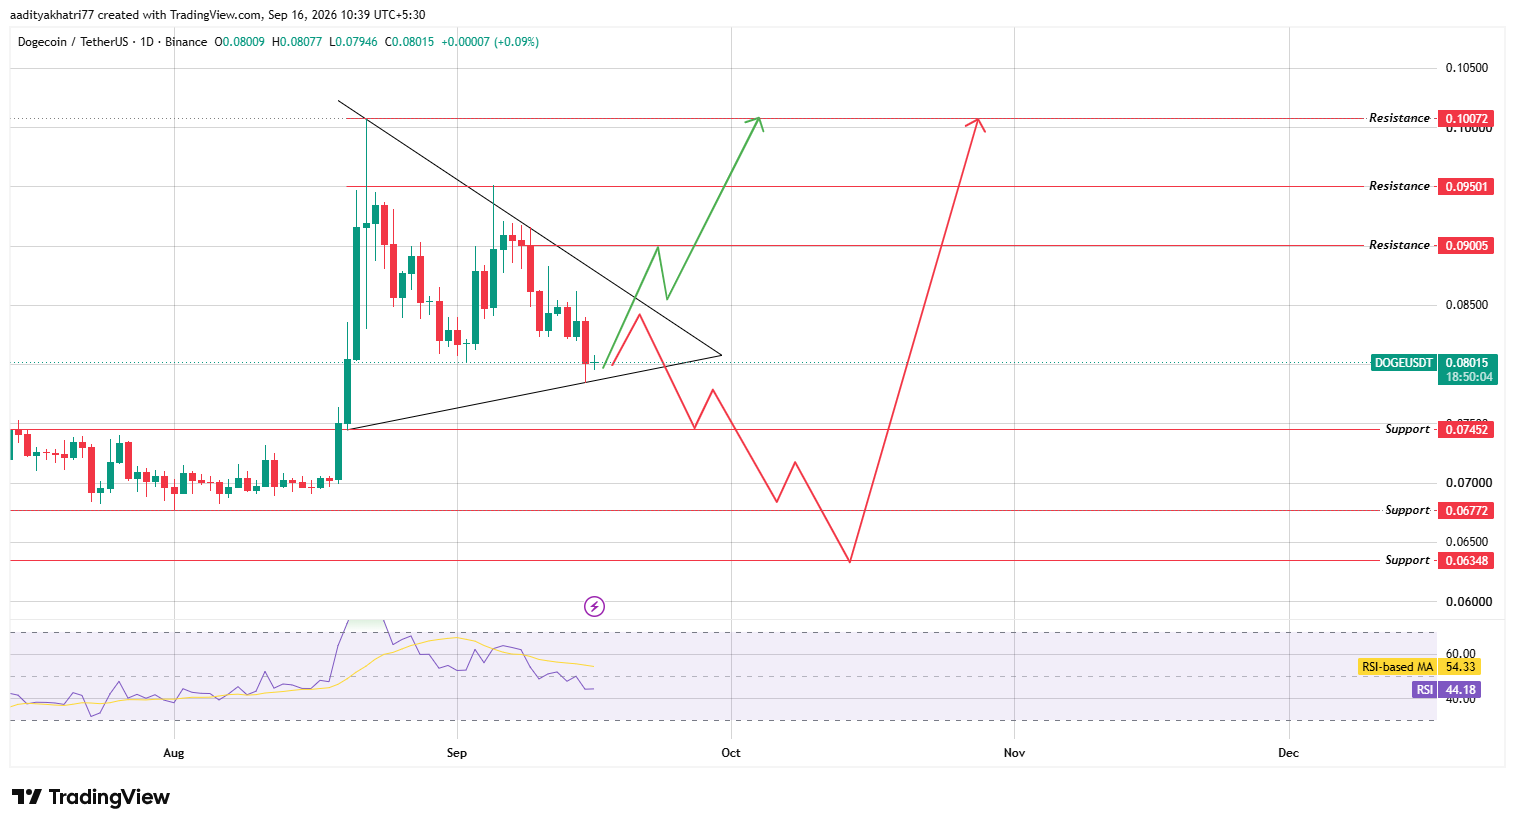
Source: Chart taken from TradingView, as of Sep 16, 2026
The RSI sits at 44.18, below its own moving average of 54.33, reflecting the indecision built into the current range.
Can $DOGE Break Out Of The Falling Trendline?
A daily candle close above the triangle's falling trendline, backed by rising volume, would point toward the first resistance at $0.09005.
Clearing that zone could open a path to $0.09501, and a confirmed breakout above this level with sustained volume would put the $0.10072 resistance in view for the first time since early August.
What If $DOGE Slips Back Toward the Rising Trendline?
If the bounce off the triangle's lower boundary fails to hold, price risks sliding back toward the rising trendline near $0.07452.
A confirmed close below this support would shift the structure bearish, opening the door to $0.06772 and, in a deeper breakdown, $0.06348.
Support and Resistance Levels
Support | Resistance |
$0.07452 | $0.09005 |
$0.06772 | $0.09501 |
$0.06348 | $0.10072 |
Scenario | Setup | Level |
Bull | Triangle breakout with volume confirmation | $0.09005–$0.10072 |
Base | Continued consolidation inside the triangle | $0.07452–$0.09005 |
Bear | Breakdown below rising trendline support | $0.06772–$0.06348 |
Dogecoin Vs Bitcoin
This supply comparison sits at the center of the current Dogecoin price prediction discussion.
Bitcoin price today reflects a scarcity-driven model where every halving tightens new supply further.
Dogecoin's approach trades that scarcity for predictability, with a known and steady issuance rate rather than a shrinking one.
Historically, DOGE still tends to move directionally with Bitcoin during broad market swings, even though its underlying supply mechanics diverge sharply.
A stabilizing Bitcoin market would likely support any Dogecoin breakout attempt, while renewed Bitcoin weakness could reinforce pressure on the triangle's lower boundary.
Methodology
This Dogecoin Price Prediction is based on daily chart analysis of the DOGE/USDT pair sourced from Binance via TradingView, covering triangle structure, RSI momentum, and defined support and resistance zones.
Liquidation and volume data reflect figures at the time of writing and can shift quickly. This analysis does not constitute financial advice.
Expert Opinion
Analysts tracking large-cap altcoins generally treat a symmetrical triangle this late in its formation as a signal that a decisive move is approaching.
The heavy long-side liquidations over the past 24 hours suggest leveraged positioning has already been tested, which some traders view as a healthier setup ahead of a potential breakout attempt.
Disclaimer: This article is for informational purposes only and does not constitute financial advice. Cryptocurrency markets are highly volatile, and prices can move sharply in either direction. Support and resistance levels discussed here are technical estimates, not guarantees, and actual price movement may differ significantly. Readers should conduct their own research before making investment decisions.













.jpg)




